New Hedger Highs in Russell 2000, Bonds and Milk; New Low in Copper
Nine markets at three-year positioning extremes in the CFTC report of 8 September 2026 — hedger highs in E-mini Russell 2000, lows in Sugar #11 and Corn.
Weekly COT extremes from the commercial book and the six-month hedging program · CFTC report 2026-09-08 · 3-year window · Data: ChartHorizon
The report dated 8 September puts nine markets at the edge of their three-year positioning range: six at lows, three at highs. The low side is last week’s farm cluster, intact — Corn, Wheat, Soybeans and Cotton at the 1st percentile, Sugar at a fresh three-year record — with Copper added to it; Corn, Wheat and Cotton came off the records they set a week ago, but none of last week’s five lows has left the board. All six trade in the upper third of their one-year price range, which is where producers sell forward, so a hedger short this deep describes the rally more than it predicts its end. The three highs are all new: the E-mini Russell 2000, the 30-Year T-Bond and Class III Milk. Lean Hogs, last week’s only high, dropped back out of the top five percent.
| Market | Side | Percentile | New |
|---|---|---|---|
| Sugar #11 | ▼ LOW | 1st | |
| Corn | ▼ LOW | 1st | |
| Wheat (Chicago SRW) | ▼ LOW | 1st | |
| Soybeans | ▼ LOW | 1st | |
| E-mini Russell 2000 | ▲ HIGH | 99th | New |
| Cotton #2 | ▼ LOW | 1st | |
| Copper | ▼ LOW | 2nd | New |
| 30-Year U.S. T-Bond | ▲ HIGH | 96th | New |
| Class III Milk | ▲ HIGH | 96th | New |
Sugar #11 — commercials at a 3-year LOW (fresh record)
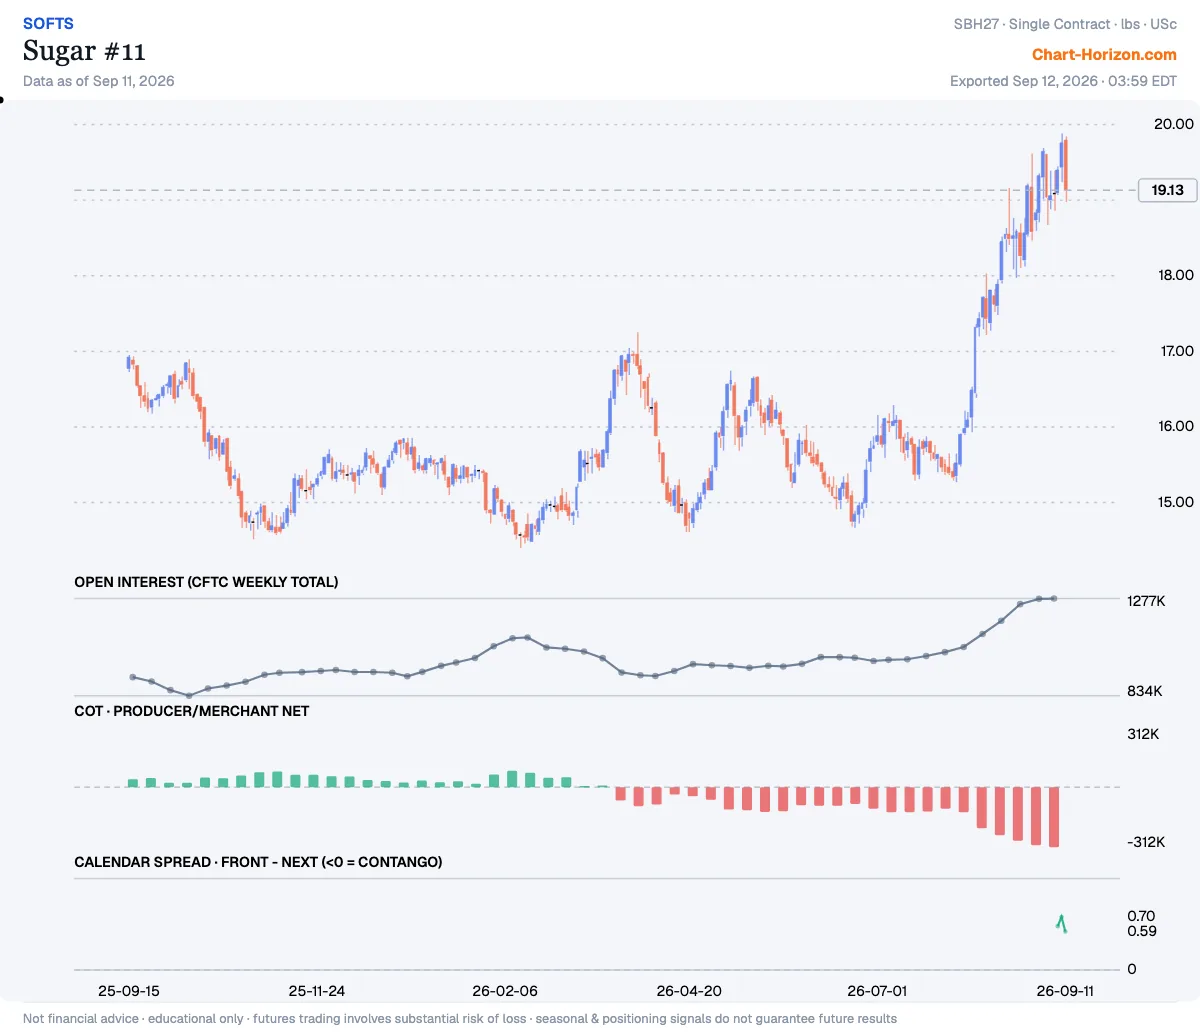
Producer/Merchant Net sits at the 1st percentile of its ~3-year range — the commercials (hedgers, the “smart-money” side) have been heavy net sellers. That is a fresh record for the window. Net: -312,352 contracts (as of 2026-09-08).
Corn — commercials at a 3-year LOW
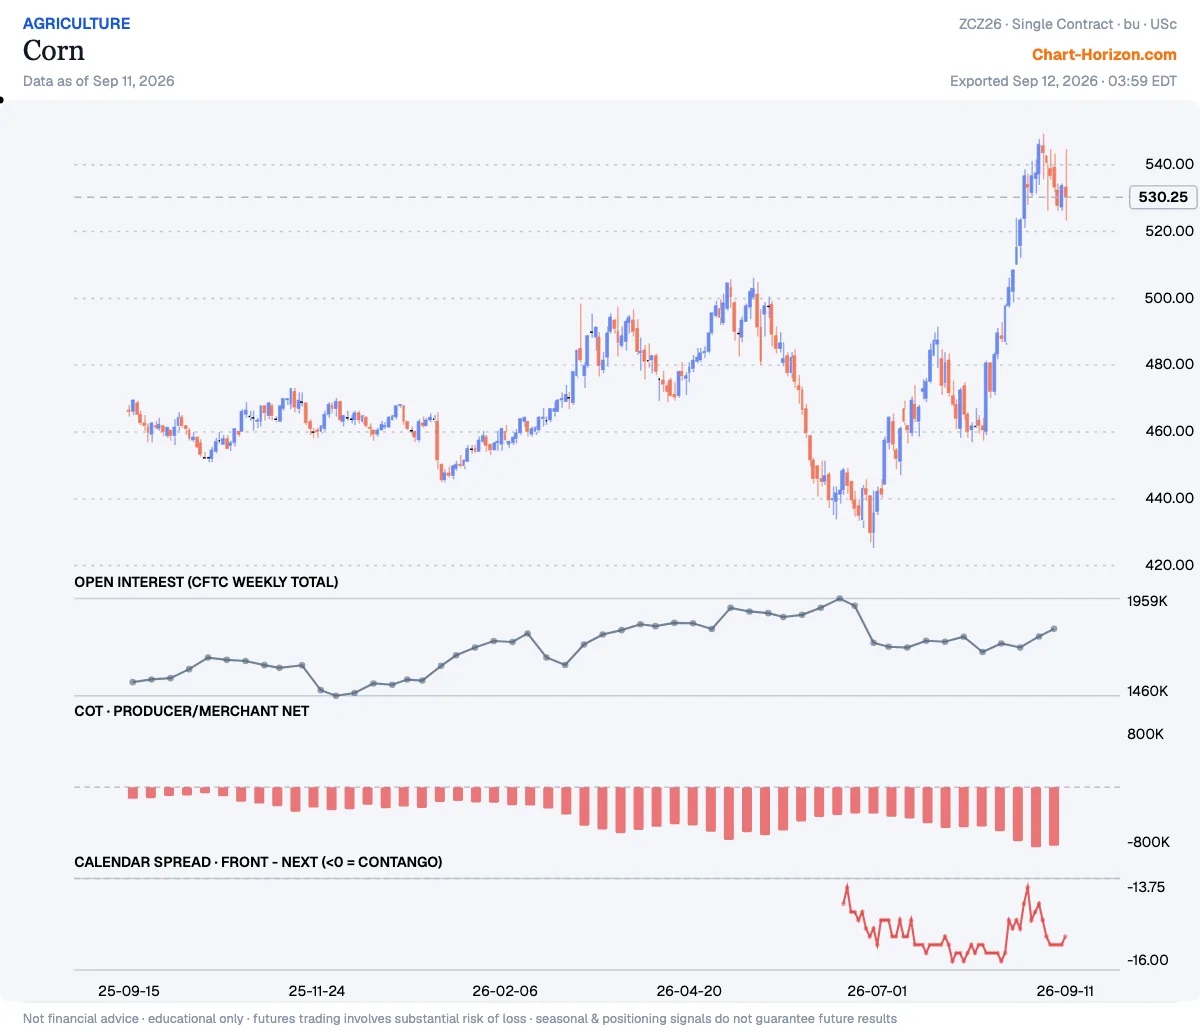
Producer/Merchant Net sits at the 1st percentile of its ~3-year range — the commercials (hedgers, the “smart-money” side) have been heavy net sellers. Net: -780,916 contracts (as of 2026-09-08).
Wheat (Chicago SRW) — commercials at a 3-year LOW
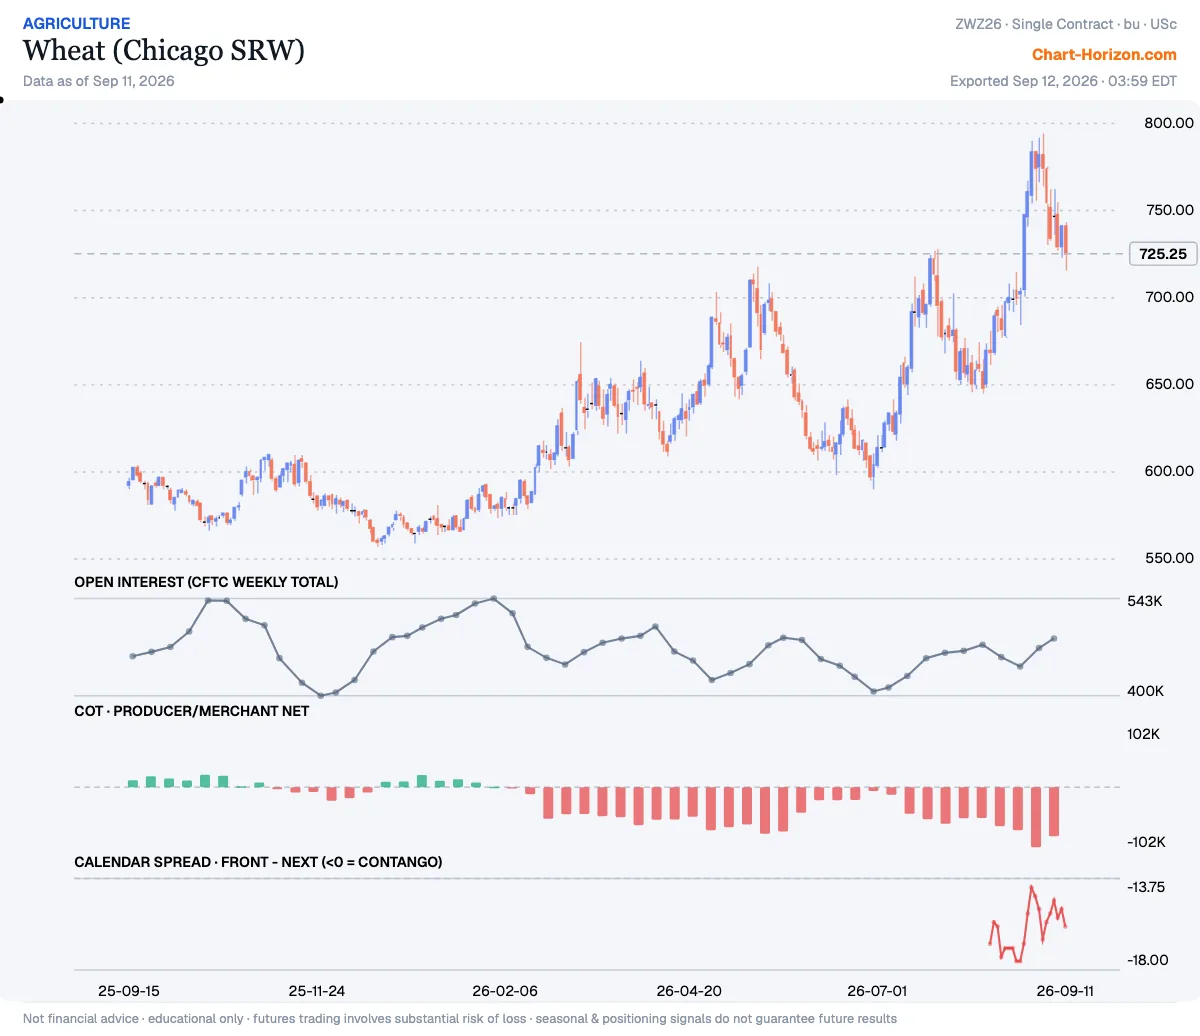
Producer/Merchant Net sits at the 1st percentile of its ~3-year range — the commercials (hedgers, the “smart-money” side) have been heavy net sellers. Net: -83,793 contracts (as of 2026-09-08).
Soybeans — commercials at a 3-year LOW
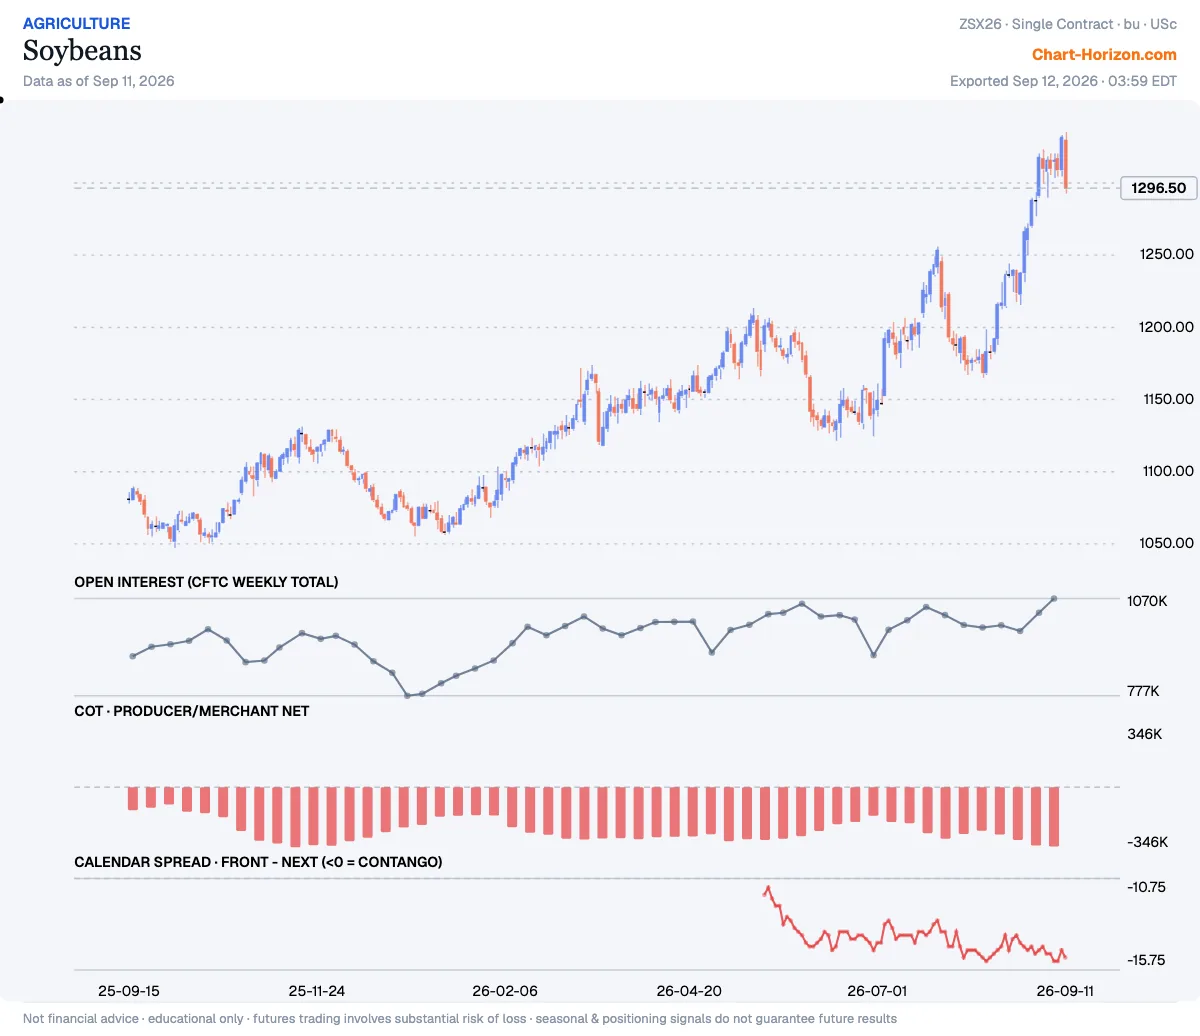
Producer/Merchant Net sits at the 1st percentile of its ~3-year range — the commercials (hedgers, the “smart-money” side) have been heavy net sellers. Net: -342,895 contracts (as of 2026-09-08).
E-mini Russell 2000 — commercials at a 3-year HIGH
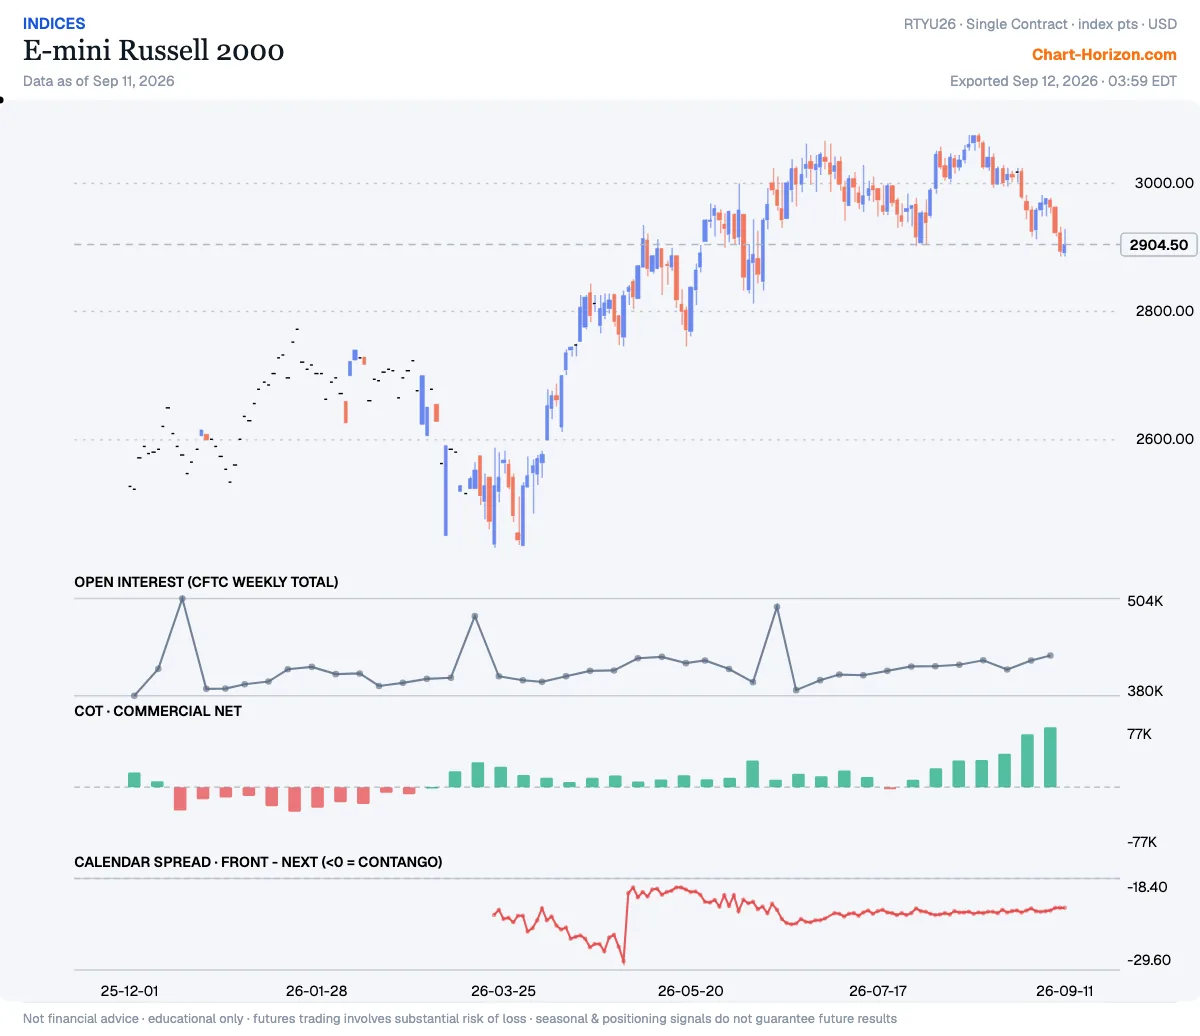
Commercial Net sits at the 99th percentile of its ~3-year range — the commercials (hedgers, the “smart-money” side) have been heavy net buyers. Net: +77,130 contracts (as of 2026-09-08). New this week.
Cotton #2 — commercials at a 3-year LOW
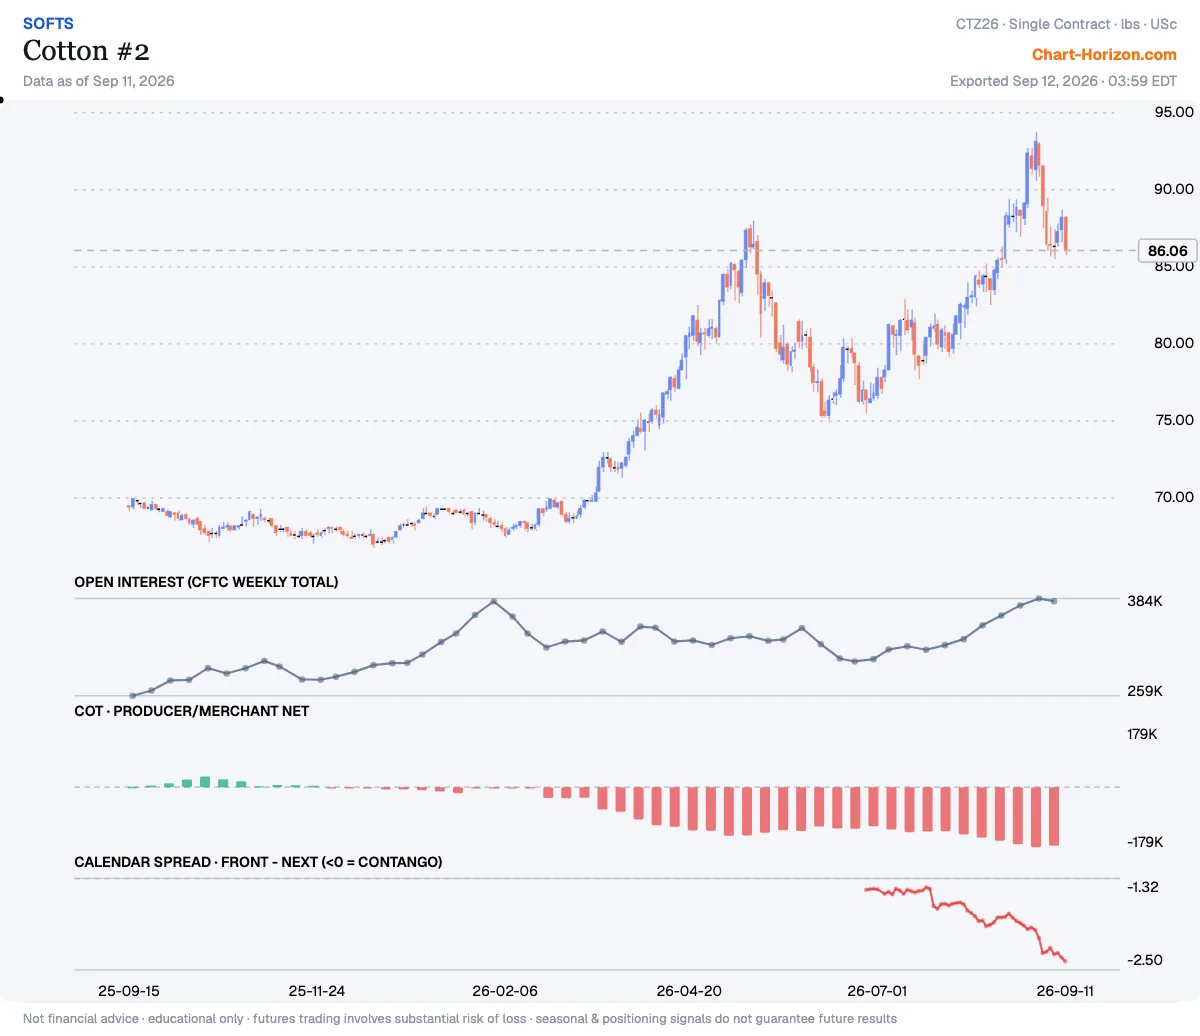
Producer/Merchant Net sits at the 1st percentile of its ~3-year range — the commercials (hedgers, the “smart-money” side) have been heavy net sellers. Net: -174,281 contracts (as of 2026-09-08).
Copper — commercials at a 3-year LOW
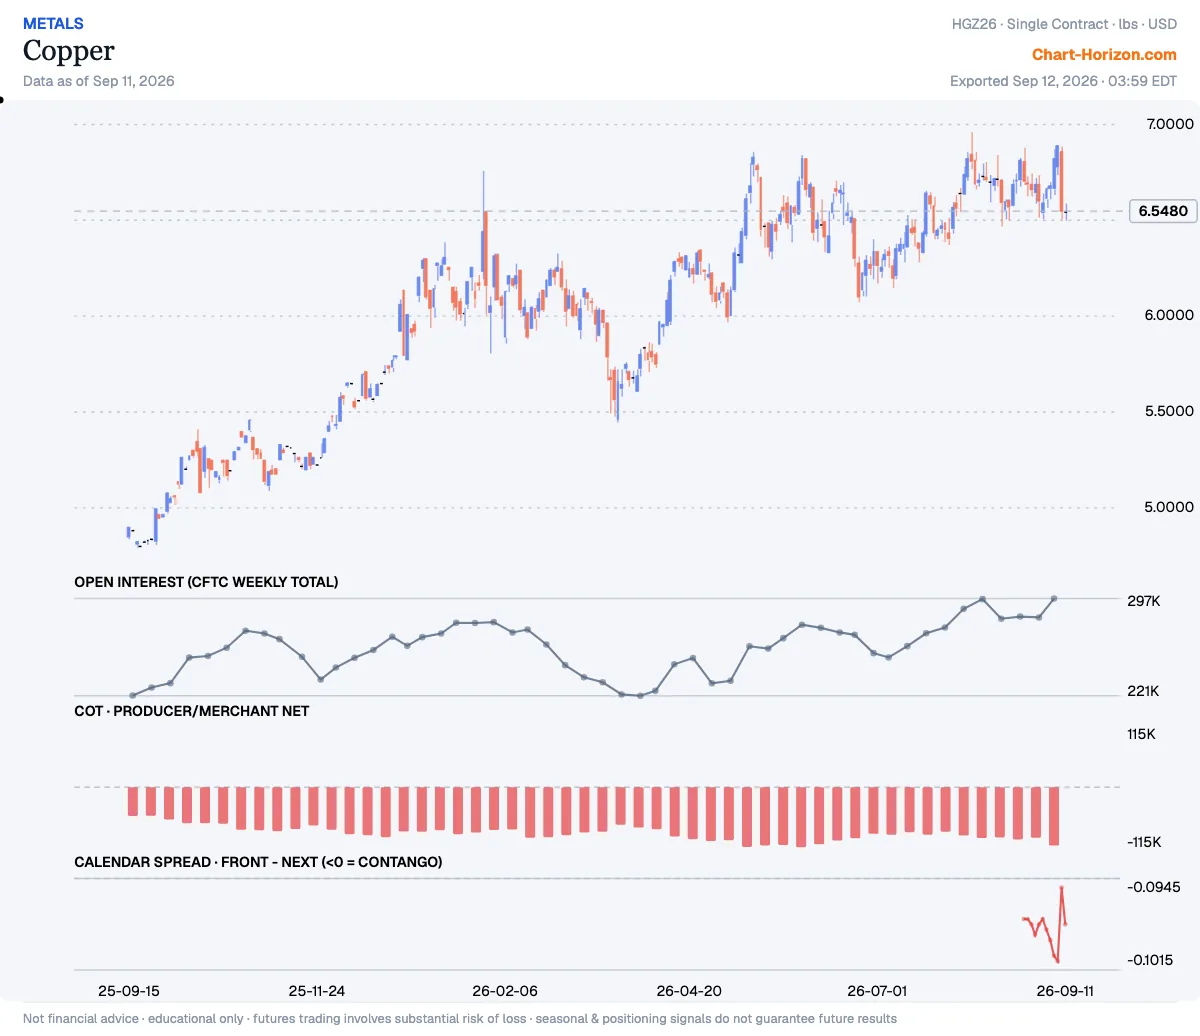
Producer/Merchant Net sits at the 2nd percentile of its ~3-year range — the commercials (hedgers, the “smart-money” side) have been heavy net sellers. Net: -111,865 contracts (as of 2026-09-08). New this week.
30-Year U.S. T-Bond — commercials at a 3-year HIGH
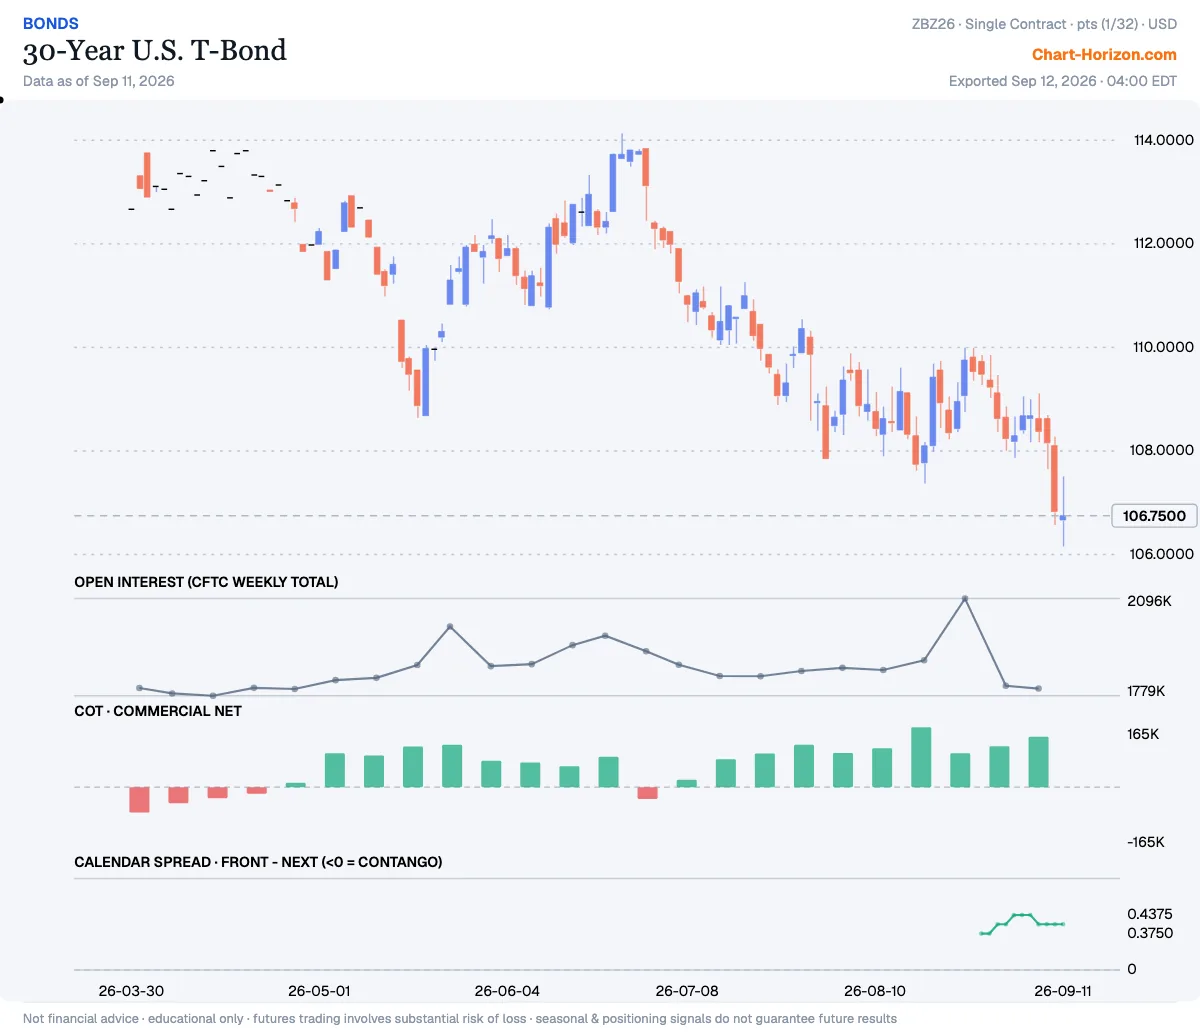
Commercial Net sits at the 96th percentile of its ~3-year range — the commercials (hedgers, the “smart-money” side) have been heavy net buyers. Net: +137,912 contracts (as of 2026-09-08). New this week.
Class III Milk — commercials at a 3-year HIGH
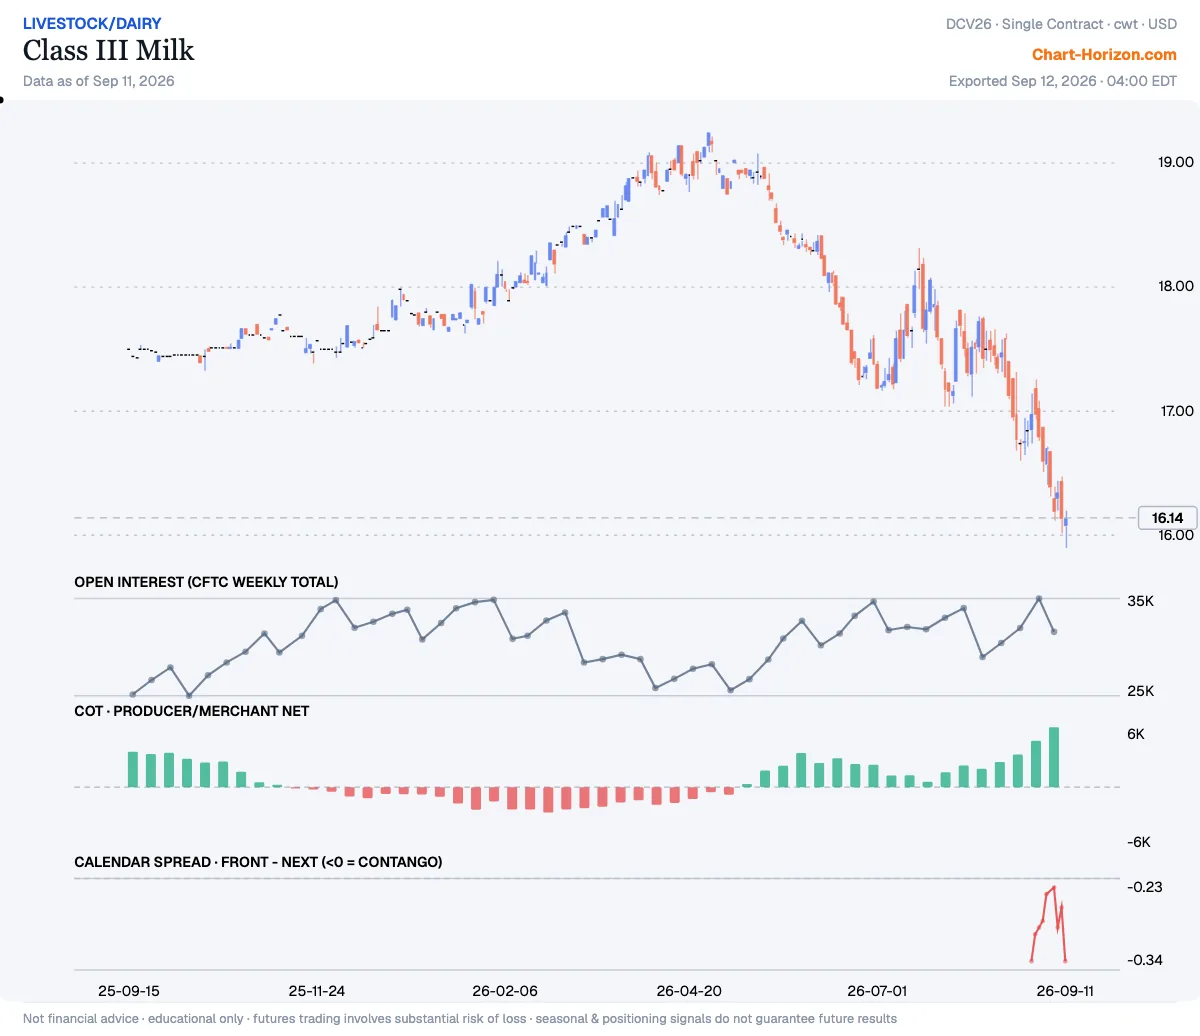
Producer/Merchant Net sits at the 96th percentile of its ~3-year range — the commercials (hedgers, the “smart-money” side) have been heavy net buyers. Net: +6,083 contracts (as of 2026-09-08). New this week.
The hedging program
Where each market’s tracked COT net sits inside its own trailing six-month range — above the midpoint of that range or below it. This is the same positioning read at close quarters, and it answers a different question from the extremes above: a book can sit at a three-year low and still have been working higher for six months. What follows is only what MOVED — the markets that crossed that midpoint with this week’s report.
16 programs read above the midpoint of their own trailing six-month range this week, 23 below. Three crossed it with this report — Platinum from above to below, Soybean Oil from below to above and Japanese Yen from above to below. Two of the three undo turns made in last week’s issue: Soybean Oil had crossed downward then, and the yen upward.
| Market | Turned | 6-month program |
|---|---|---|
| Platinum | from above the midpoint | ▼ below midpoint |
| Soybean Oil | from below the midpoint | ▲ above midpoint |
| Japanese Yen | from above the midpoint | ▼ below midpoint |
Platinum — the program turns bearish
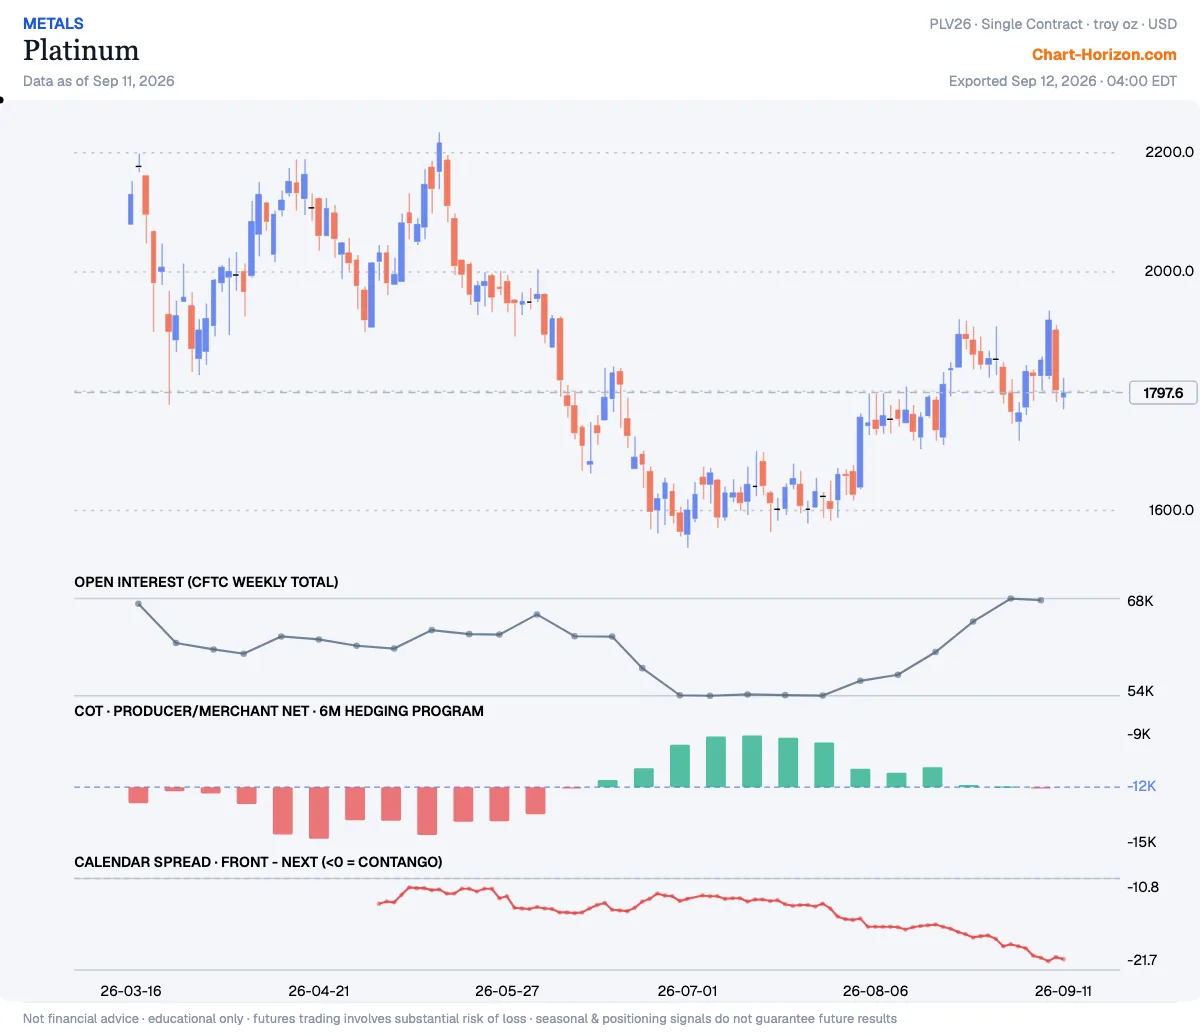
In the CFTC report of 2026-09-08, Producer/Merchant Net crossed the midpoint of its own trailing six-month range: it now sits below that midpoint, where the previous report still had it above. It cleared that midpoint by 1.4% of the window’s own range — a crossing on the definition, and a coin-flip in fact.
Soybean Oil — the program turns bullish
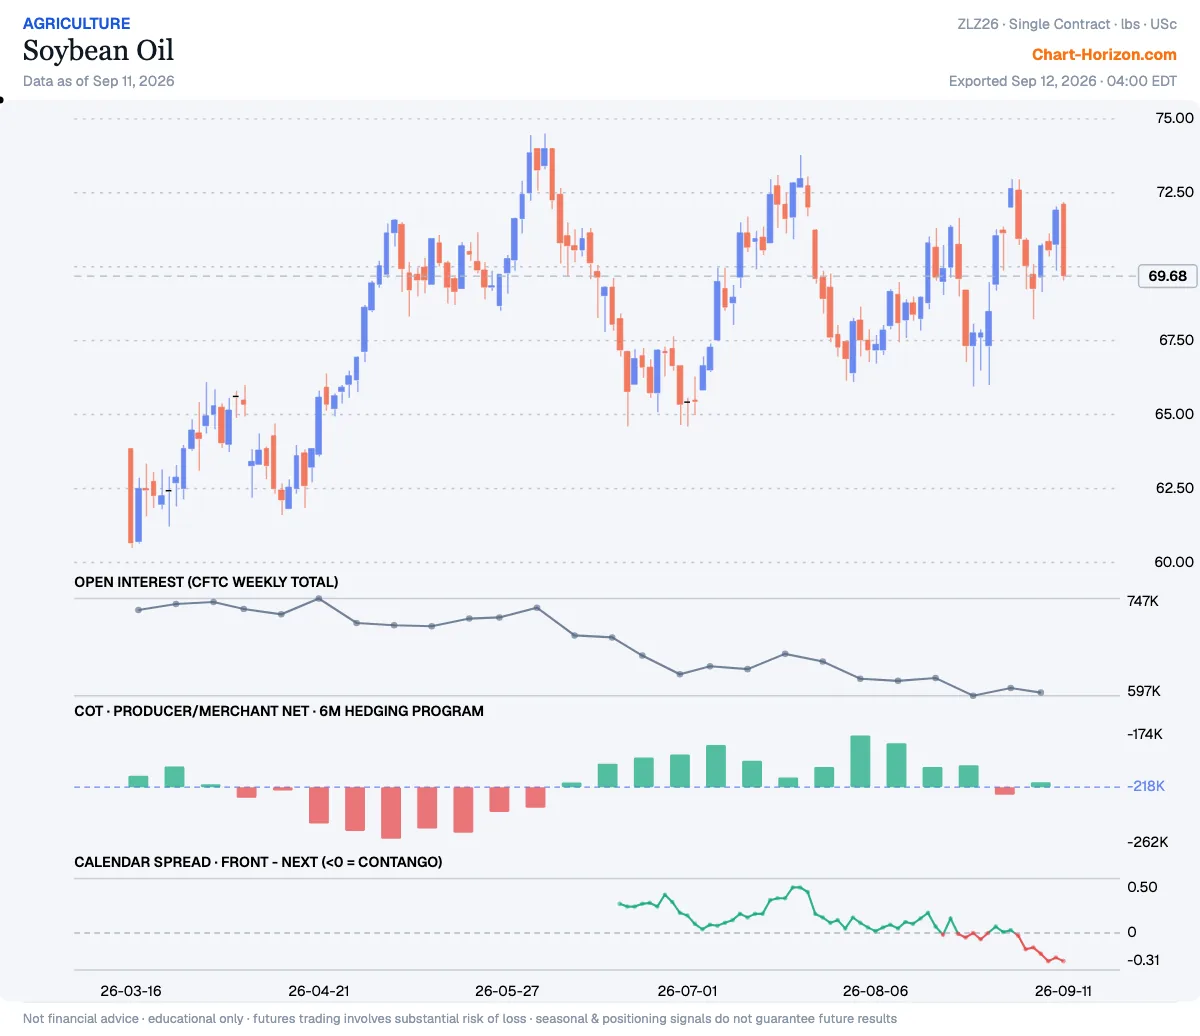
In the CFTC report of 2026-09-08, Producer/Merchant Net crossed the midpoint of its own trailing six-month range: it now sits above that midpoint, where the previous report still had it below. It cleared that midpoint by 4.7% of the window’s own range.
Japanese Yen — the program turns bearish
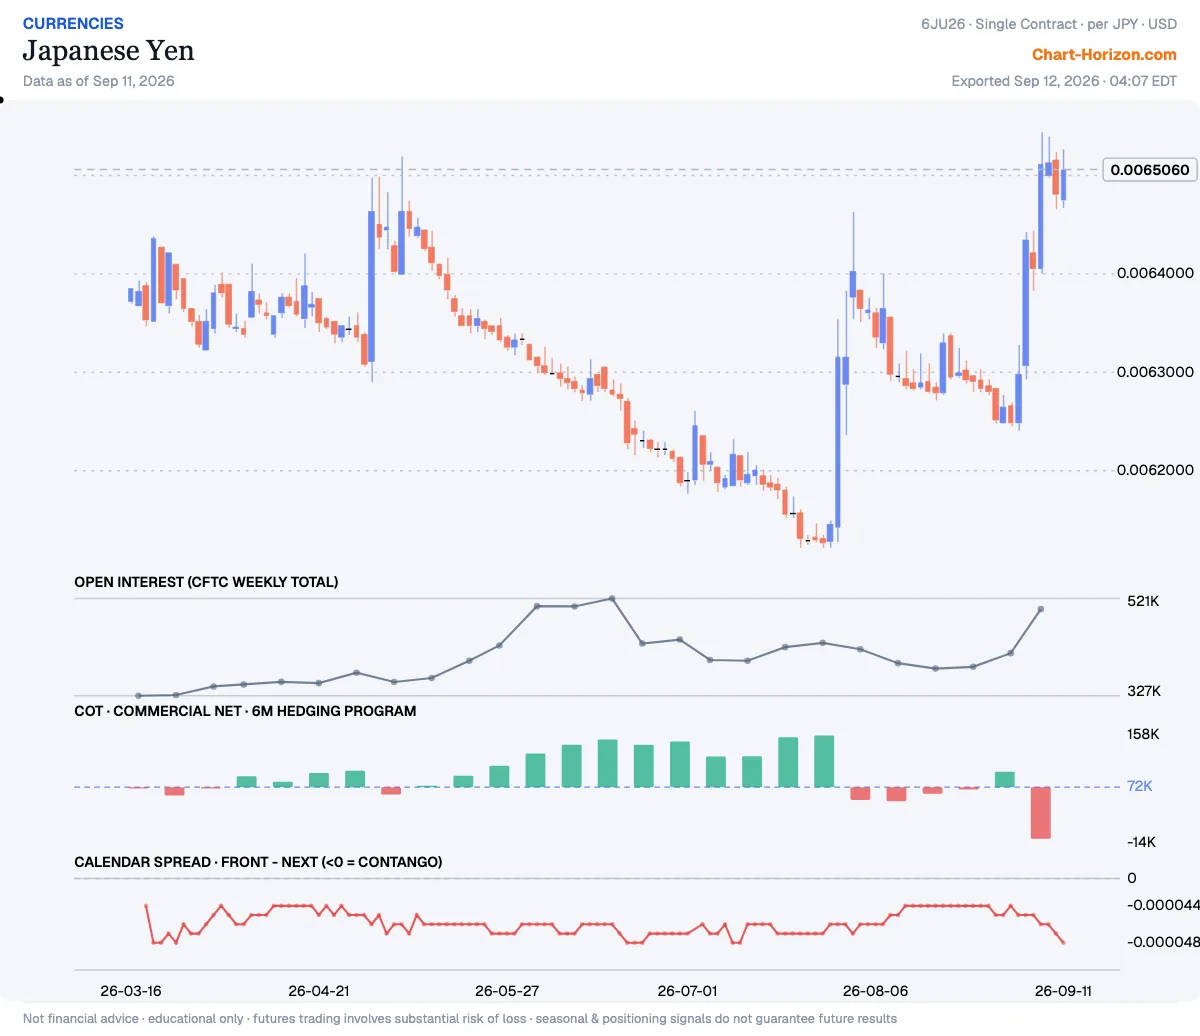
In the CFTC report of 2026-09-08, Commercial Net crossed the midpoint of its own trailing six-month range: it now sits below that midpoint, where the previous report still had it above. It cleared that midpoint by 50.0% of the window’s own range — which is all the distance there is: the net now sits at the bottom of its six-month window.
It got there in one report: Commercial Net fell from +97,561 contracts to −14,041, the largest one-week move for this market in an archive that starts in June 2021, while the yen futures price rose 4.2%. This is the book whose rebuild The Cheaper Instrument counted on 6 September as a test met, naming a long that keeps climbing through the Bank of Japan’s meeting on the 18th as the confirmation to watch; a week before that meeting, the book is net short. The report was taken in the week before the September contract expires, when a roll can swell open interest (up 87,753 here), but across the 20 earlier reports from that week the net never moved more than 30,963 contracts — and the report dated 15 September, the first without that contract, is published on the day of the meeting.
Informational and educational only — not financial advice. Futures trading involves substantial risk of loss; seasonal and positioning signals do not guarantee future results. Signals and charts: ChartHorizon (local end-of-day data).