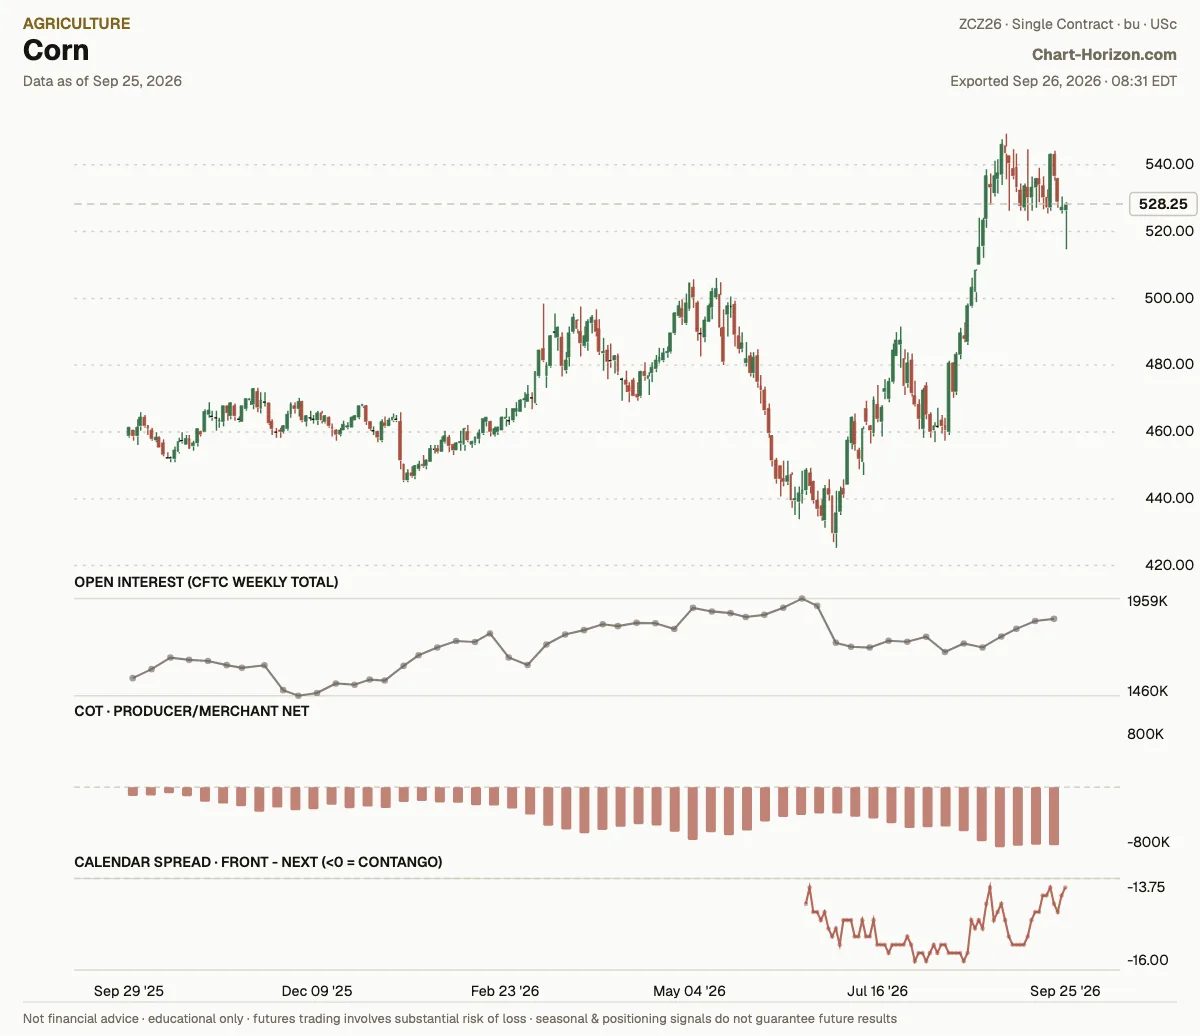
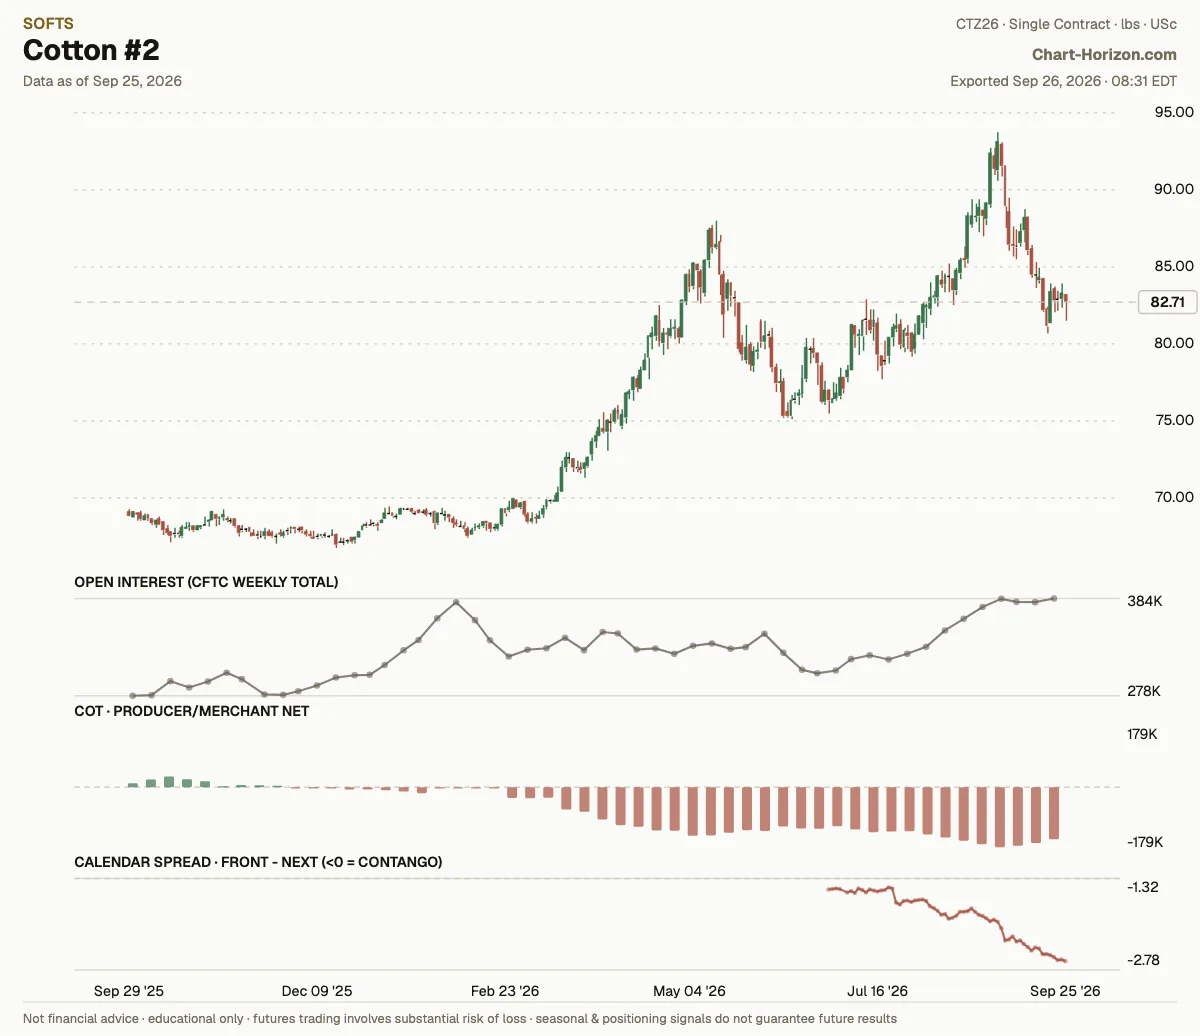
Jekyll2026-10-13T08:33:38+02:00https://chart-horizon.com/feed.xmlChartHorizonWeekly futures positioning notes from the CFTC Commitments of Traders report — where season, the hedging program and term structure line up. Data: ChartHorizon.ChartHorizonNew Hedger High in Euro; New Low in Brent; Record Low in Nasdaq 1002026-10-10T00:00:00+02:002026-10-10T00:00:00+02:00https://chart-horizon.com/2026/10/10/hedgers-ledgerThe report dated 2026-10-06 puts ten markets at a three-year positioning extreme: six at highs, four at lows. Four of them set fresh window records with this report, Euro FX and Lean Hogs on the high side, the E-mini Nasdaq 100 and Sugar on the low. Euro FX went from off the list to a record in a single week: the commercial net rose from +40,577 to +72,024 contracts, clear of the window’s previous high of +55,114 from December 2024. Two markets are new to the list, Euro FX at a high and Brent Crude Oil at a low. Two left it since last week: the 5-Year U.S. T-Note and Corn. Two of last week’s four records stay on it without a new one, Class III Milk at the 99th percentile and the 2-Year T-Note at the 4th. Brent is the one market in both halves of this issue, a new three-year extreme and one of the five programs below that crossed their six-month midpoint with this report.
Percentile is where this week’s net sits inside its own 3-year range. How the desk reads positioning: About the desk.
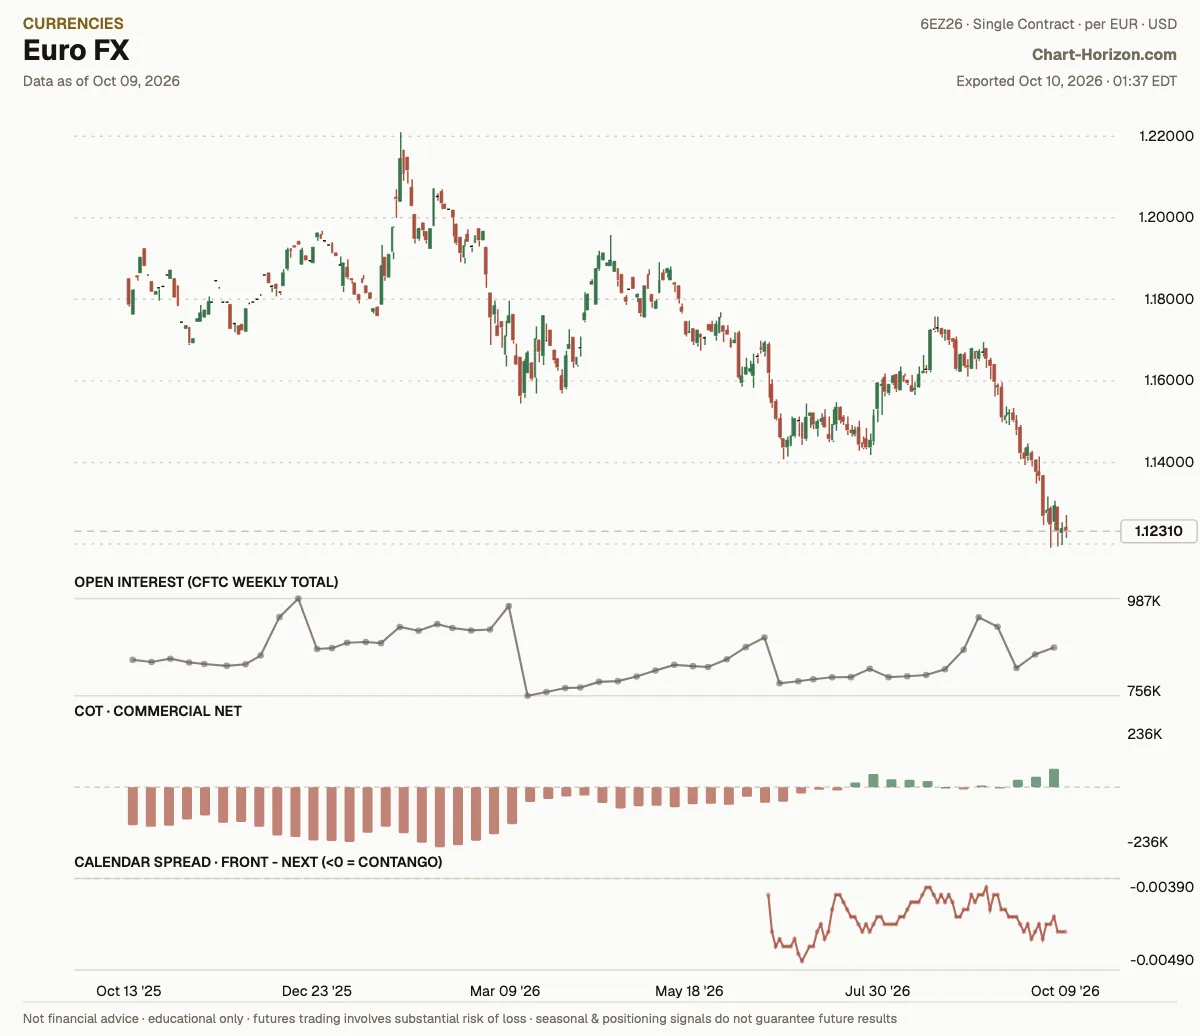
Euro FX: commercials at a 3-year high, a fresh record
Commercial Net sits at the 100th percentile of its ~3-year range. The commercials (the hedgers) have been heavy net buyers. That is a fresh record for the window. Net: +72,024 contracts (as of 2026-10-06). New this week.
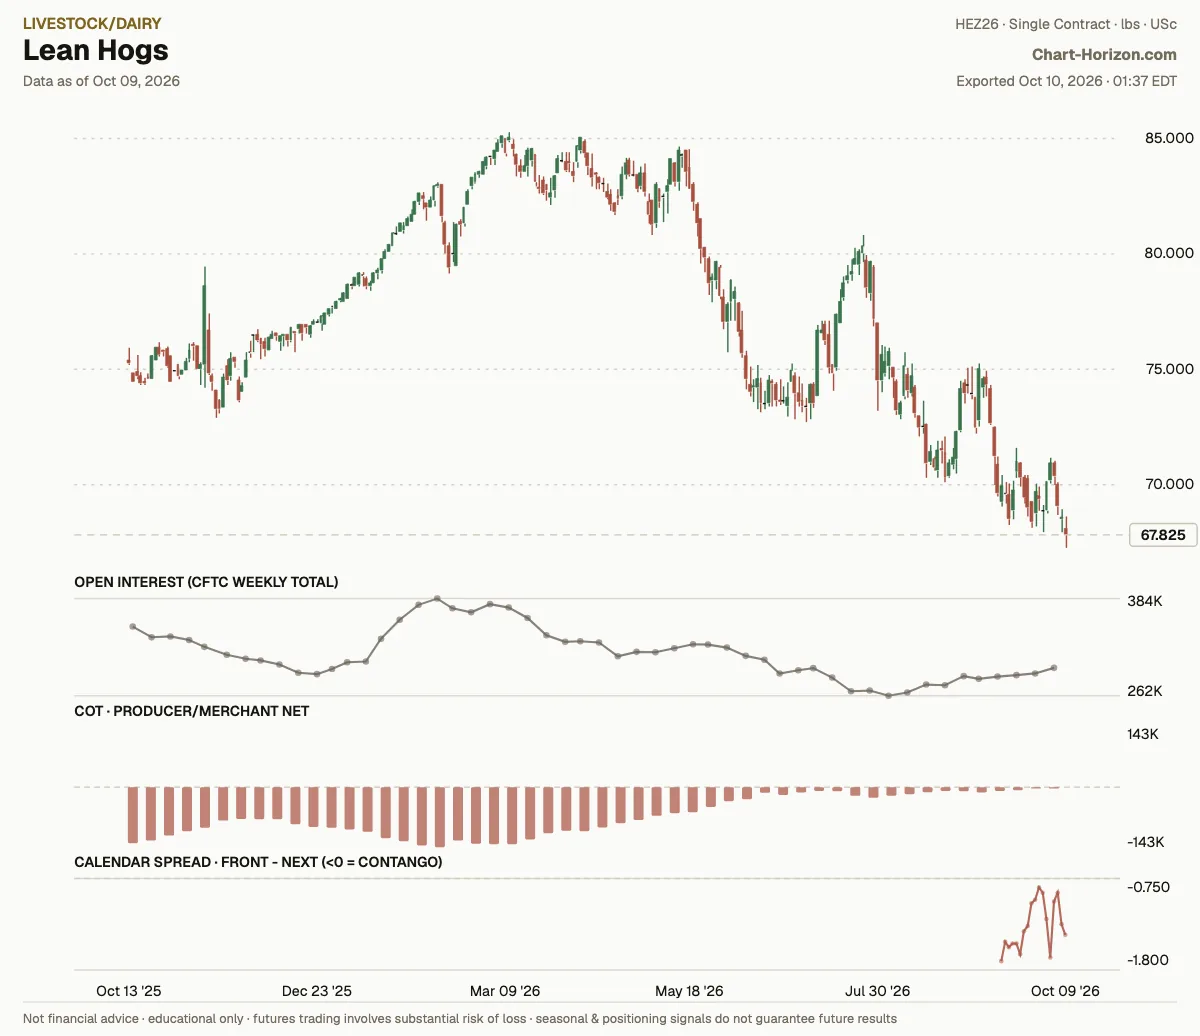
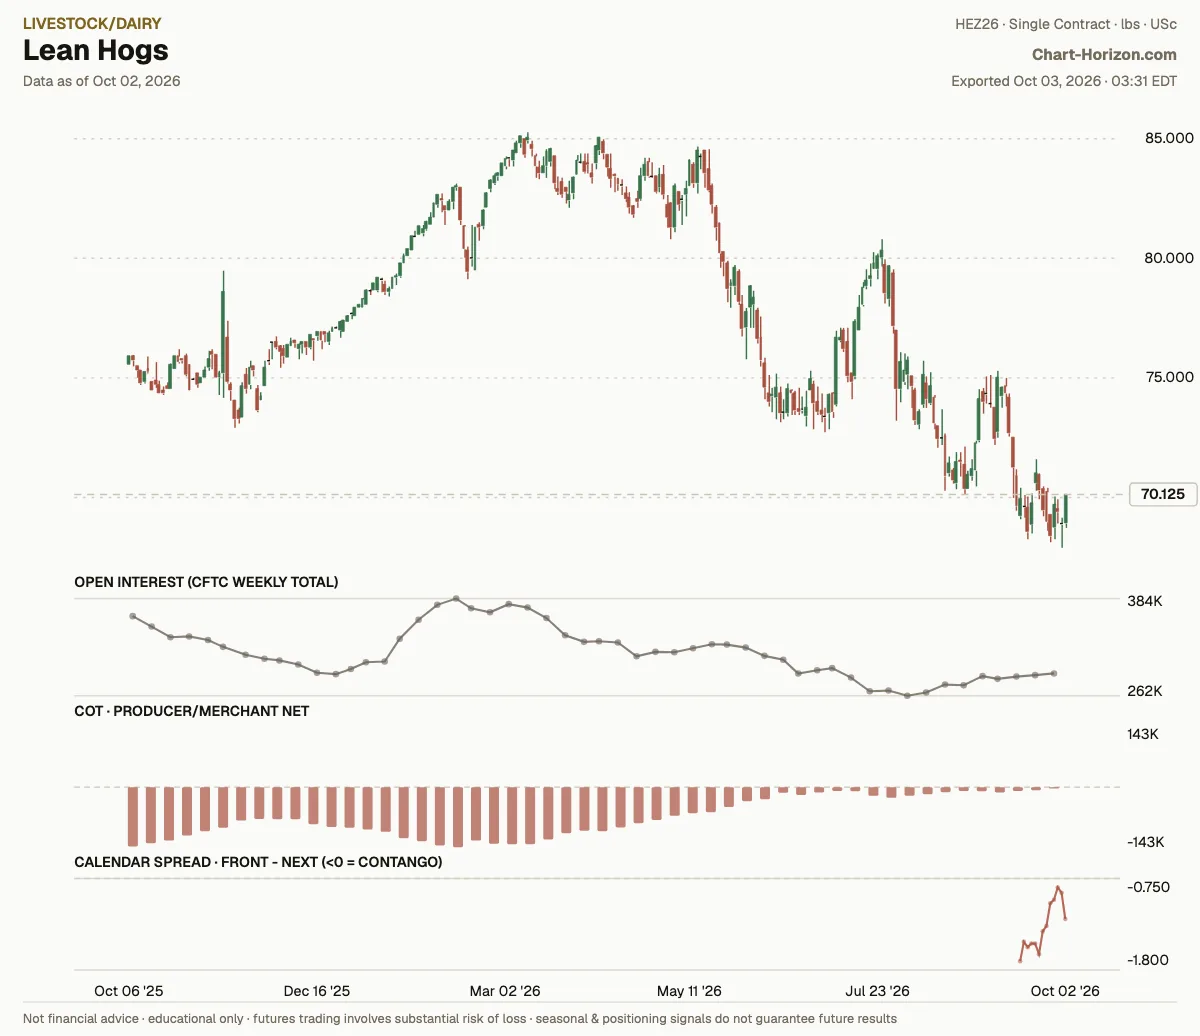
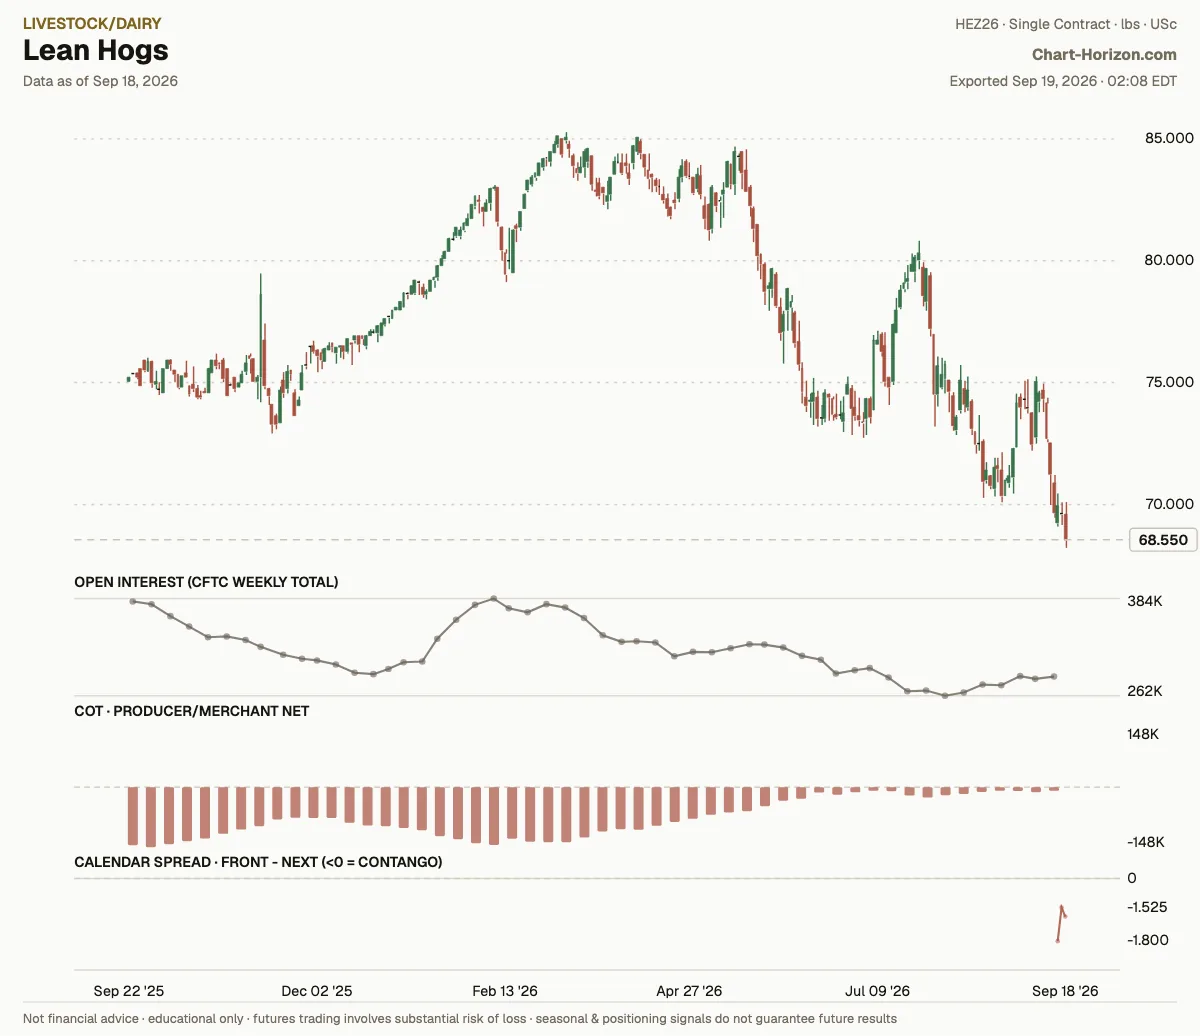
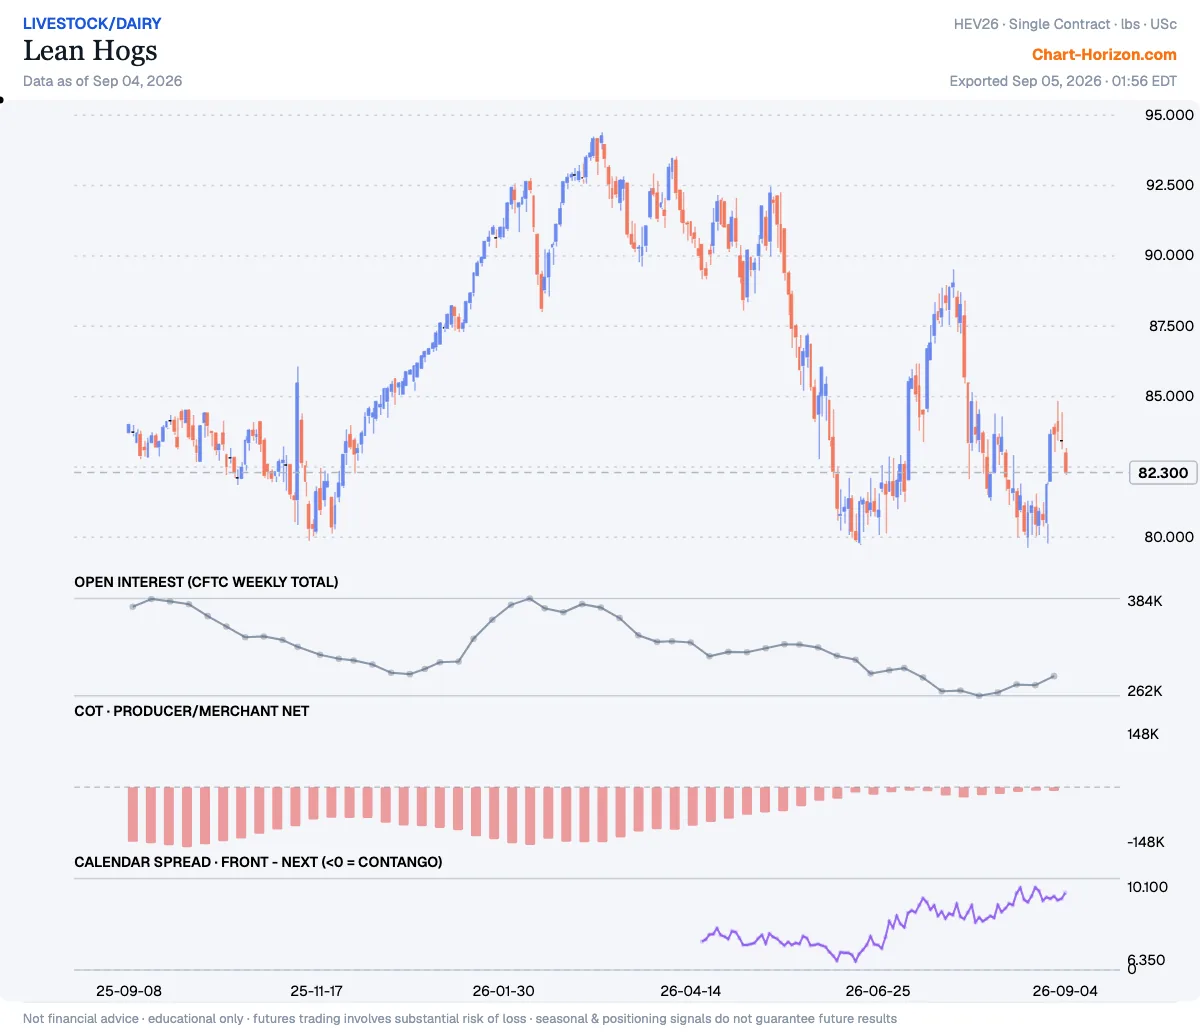
Lean Hogs: commercials at a 3-year high, a fresh record
Producer/Merchant Net sits at the 100th percentile of its ~3-year range. The commercials have covered shorts toward the least-short end of the window; the book is still net short. That is a fresh record for the window. Net: -2,418 contracts (as of 2026-10-06).
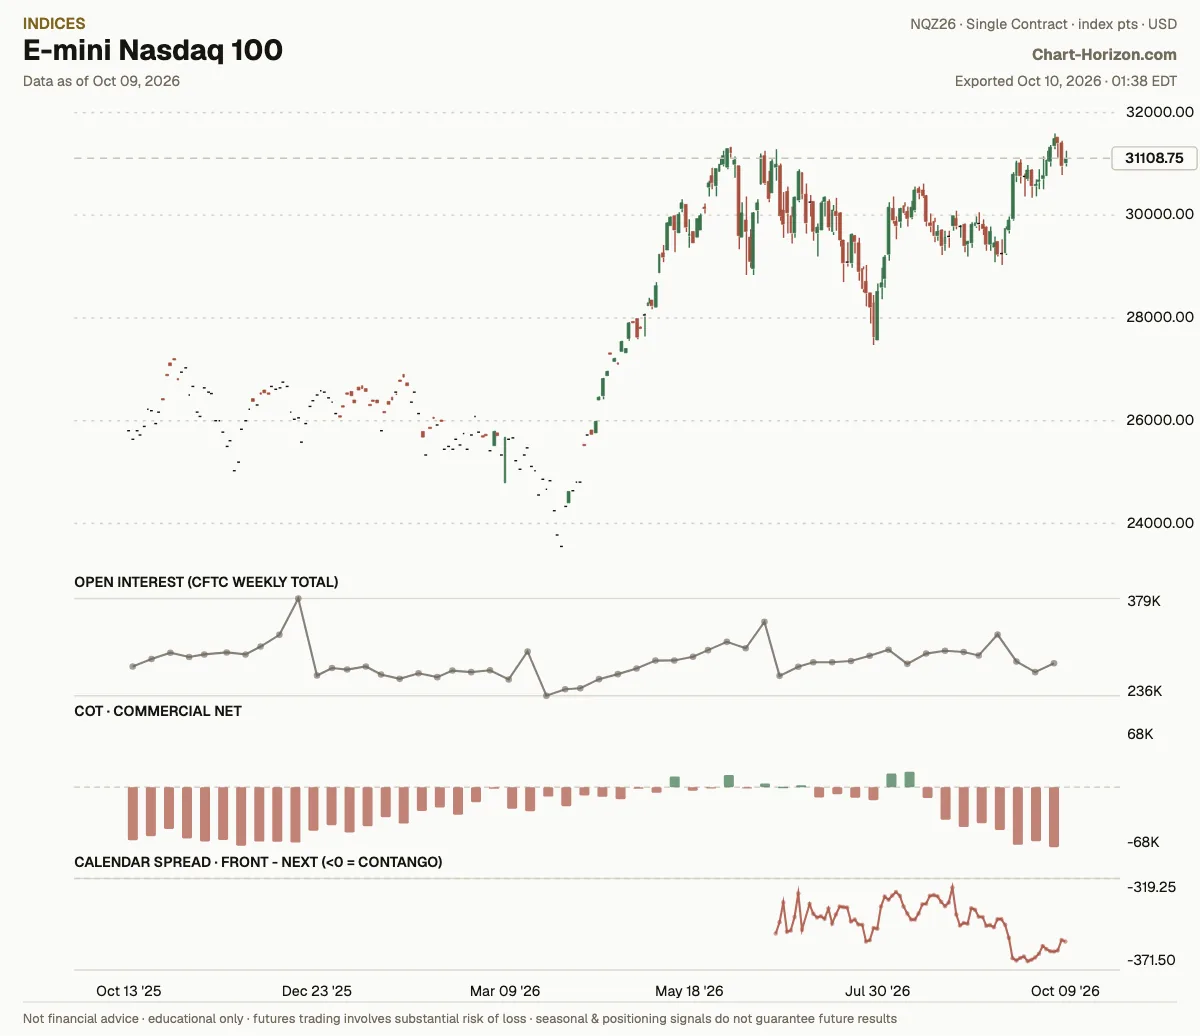
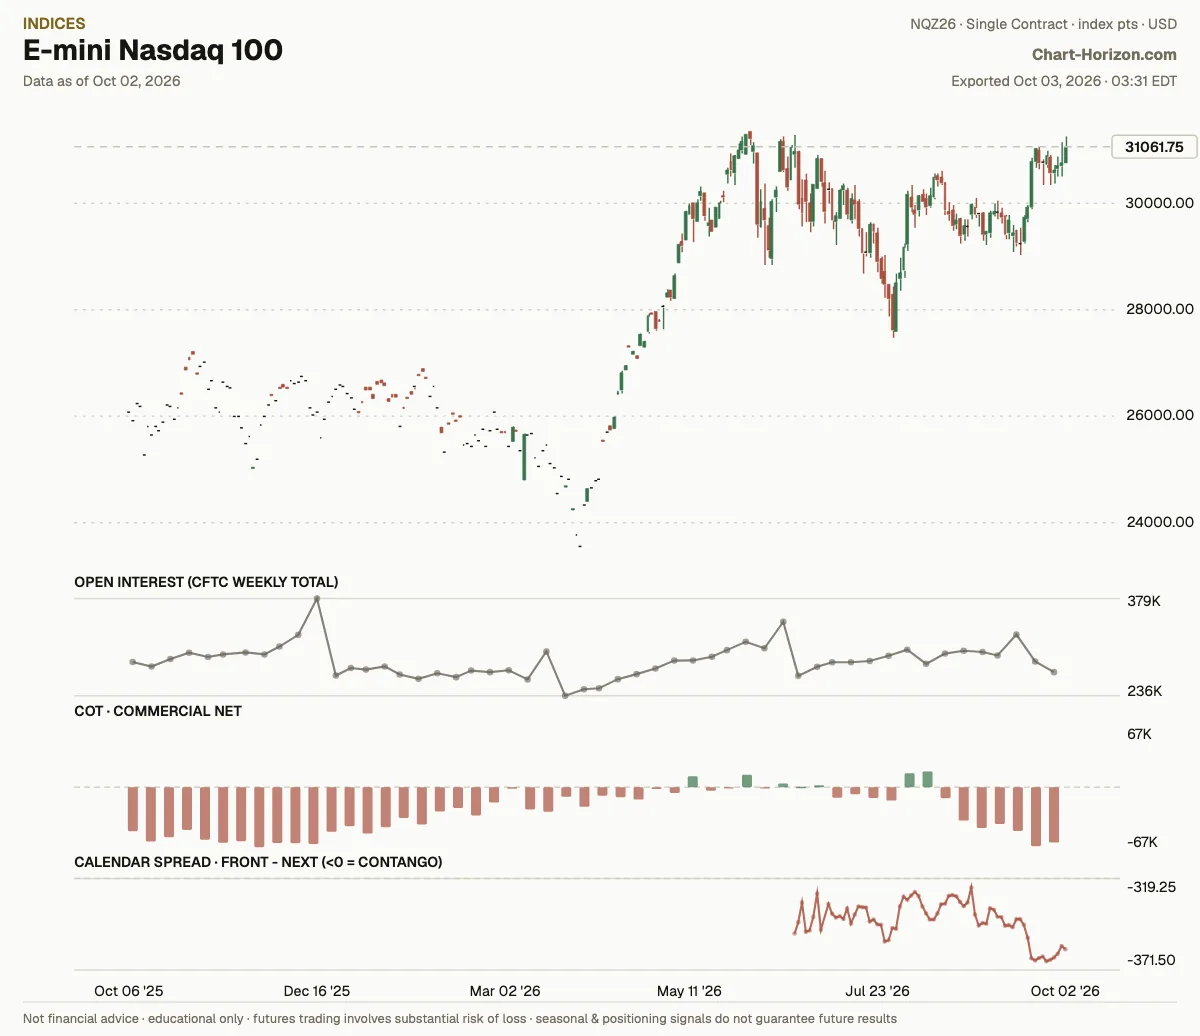
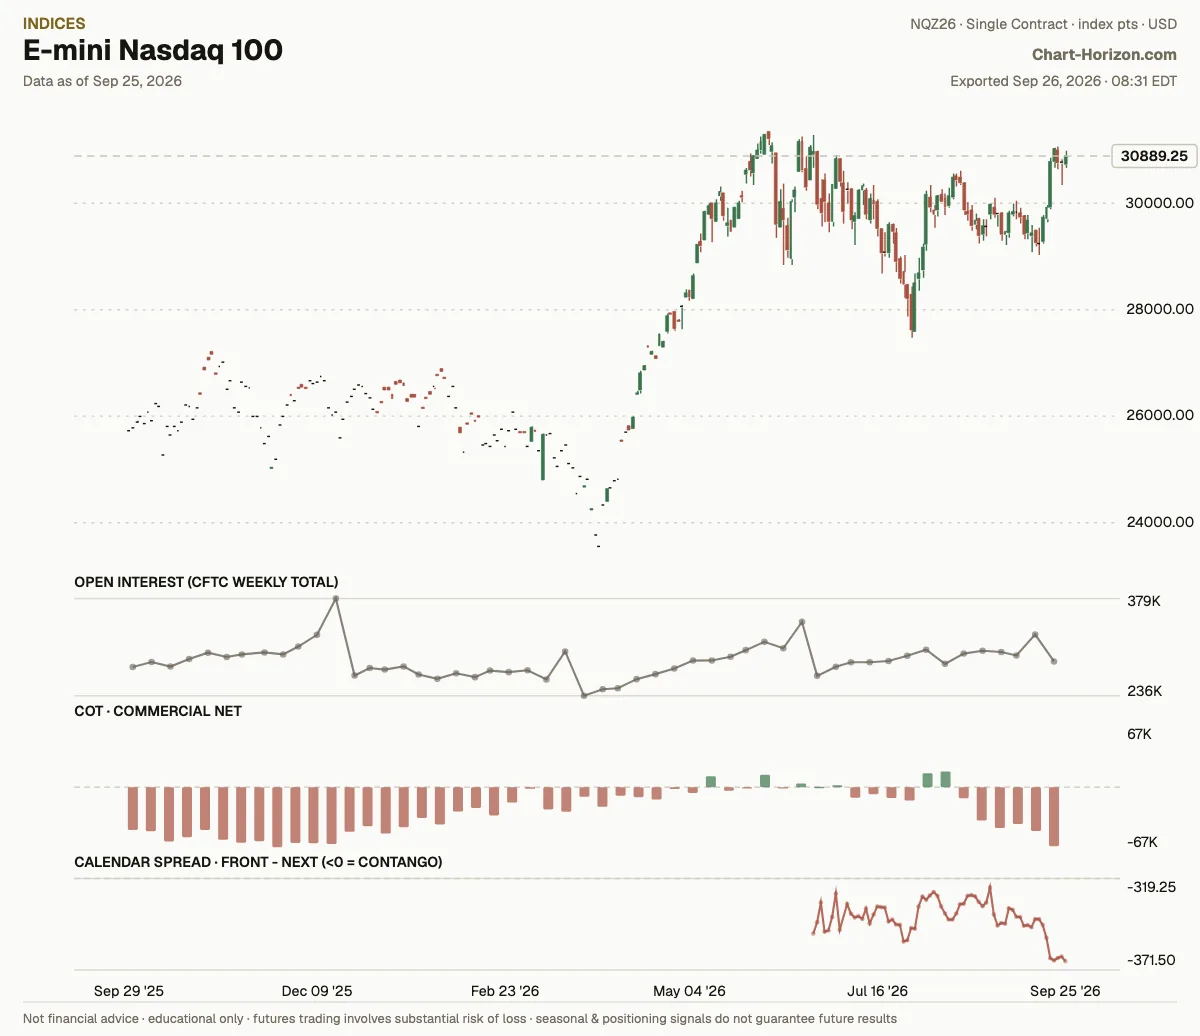
E-mini Nasdaq 100: commercials at a 3-year low, a fresh record
Commercial Net sits at the 1st percentile of its ~3-year range. The commercials have been heavy net sellers. That is a fresh record for the window. Net: -68,446 contracts (as of 2026-10-06).
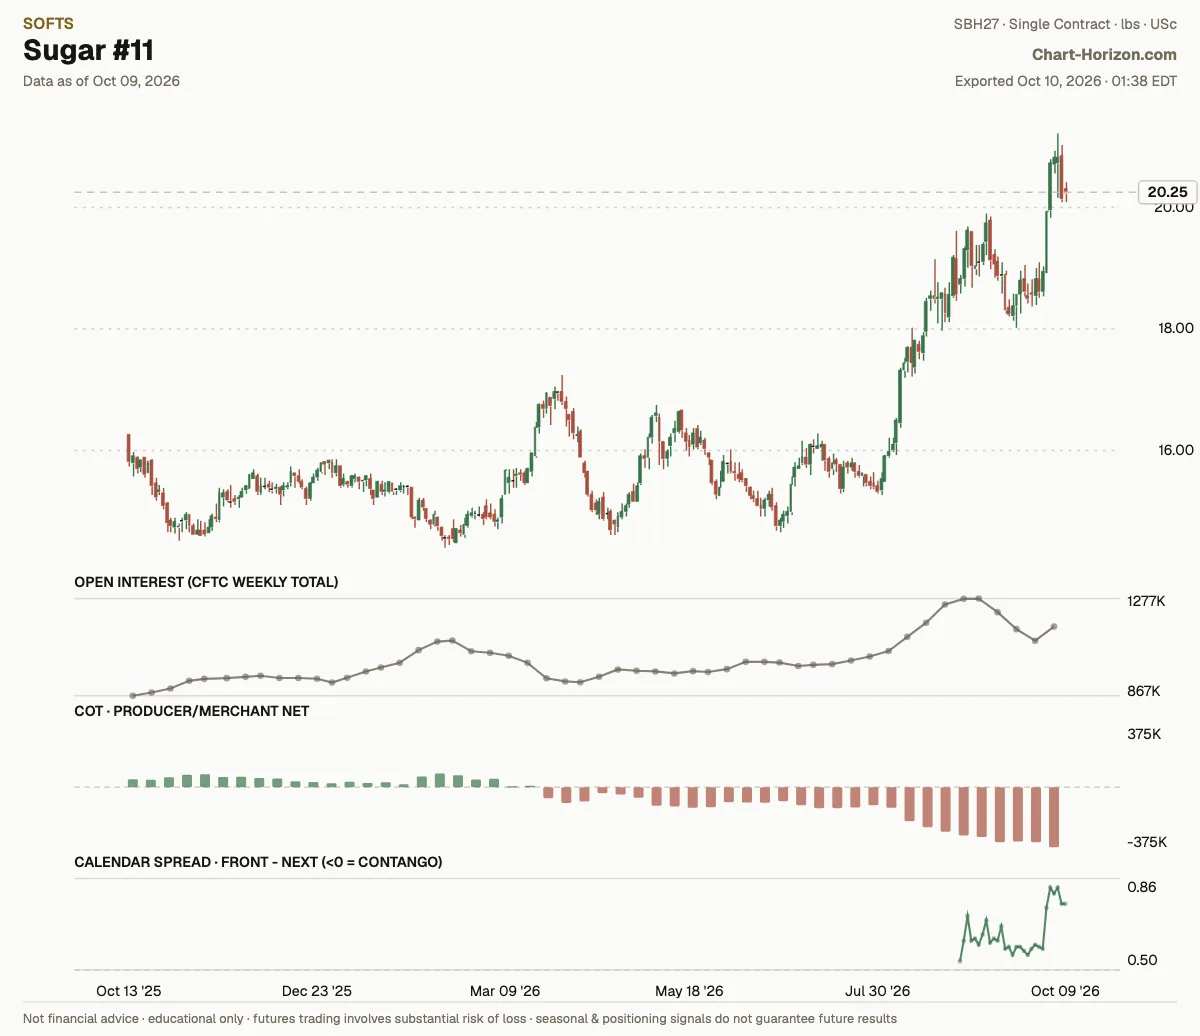
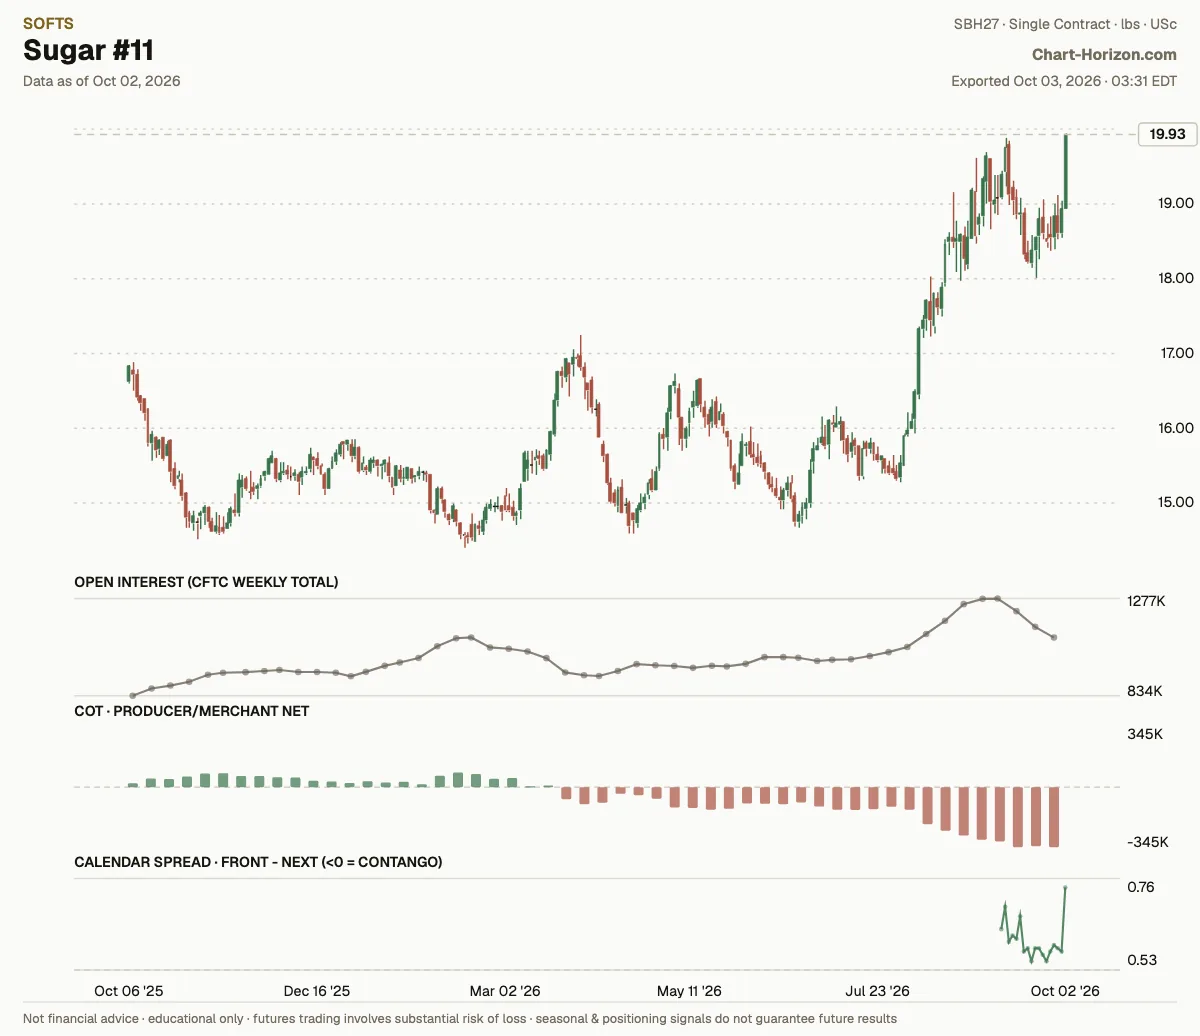
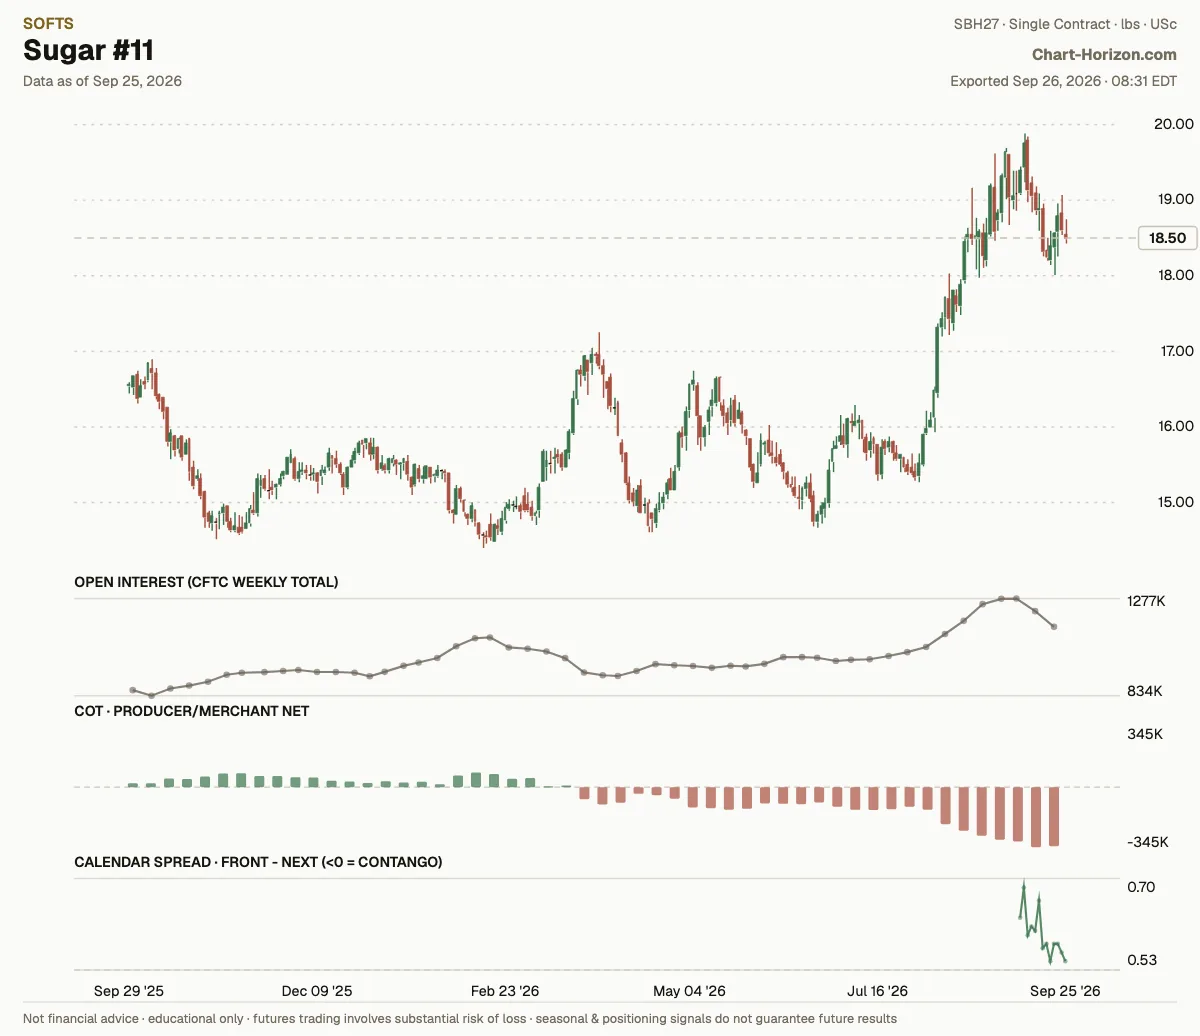
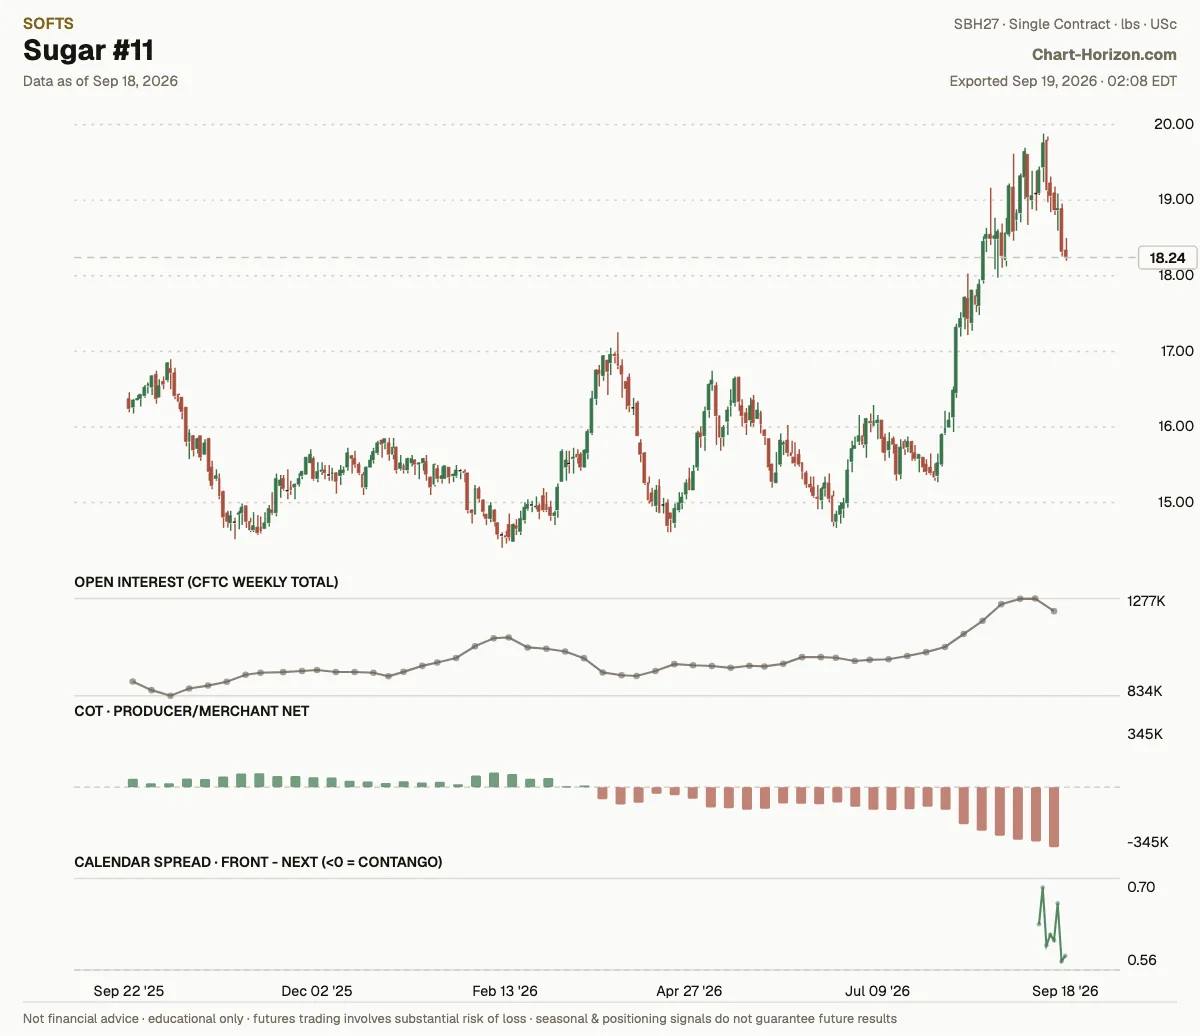
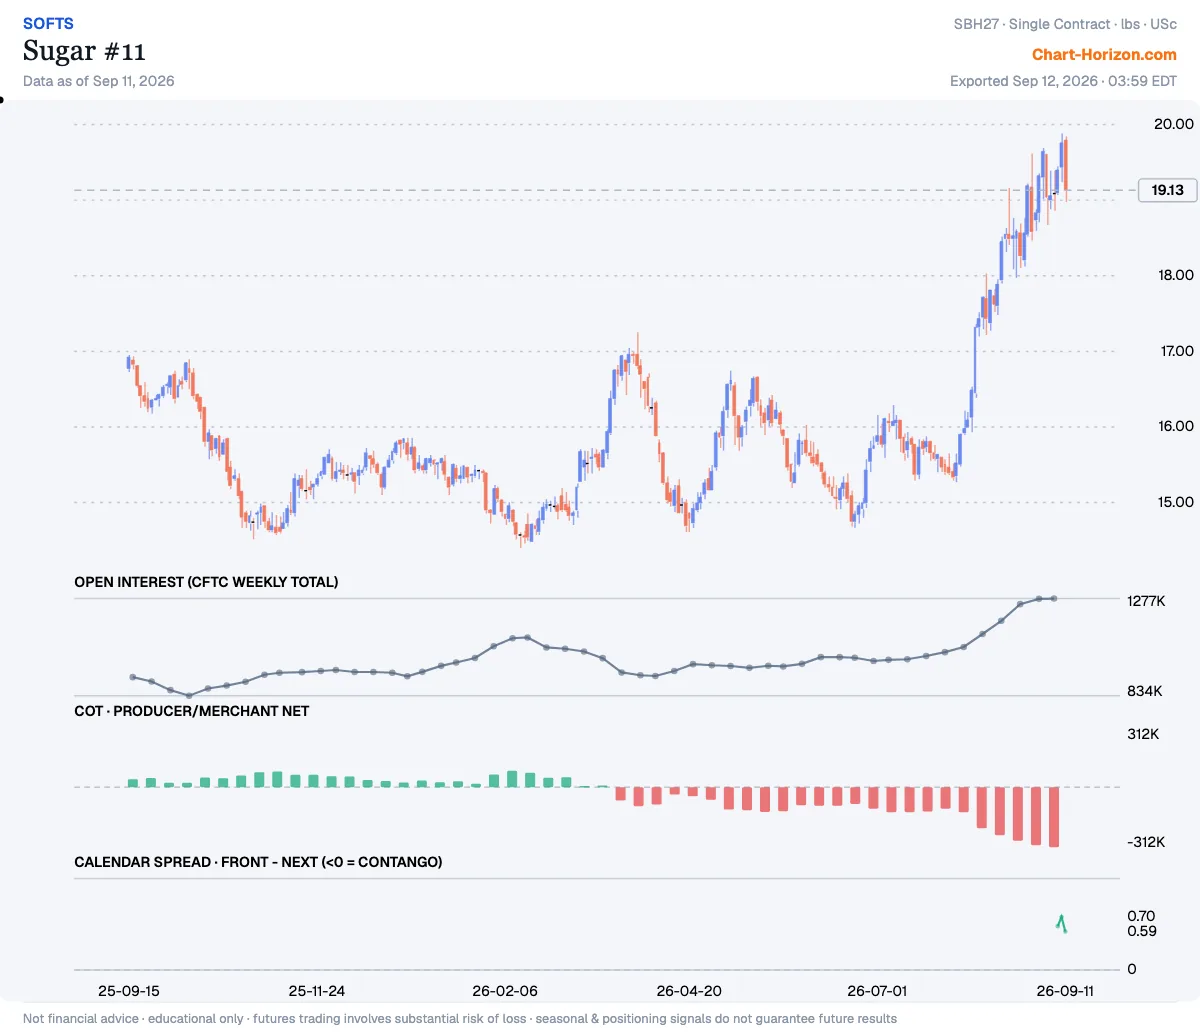
Sugar #11: commercials at a 3-year low, a fresh record
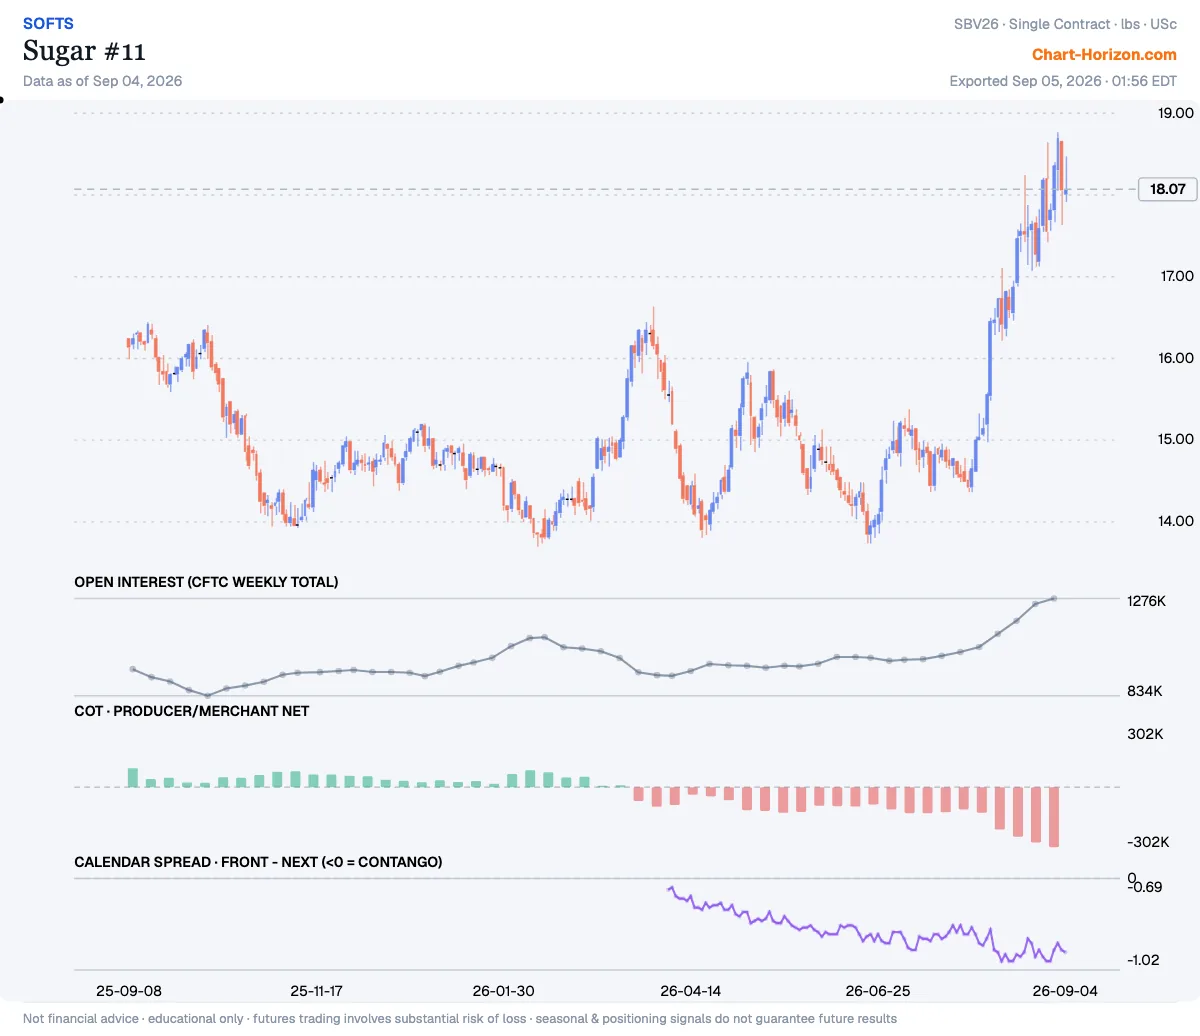
Producer/Merchant Net sits at the 1st percentile of its ~3-year range. The commercials have been heavy net sellers. That is a fresh record for the window. Net: -375,370 contracts (as of 2026-10-06).
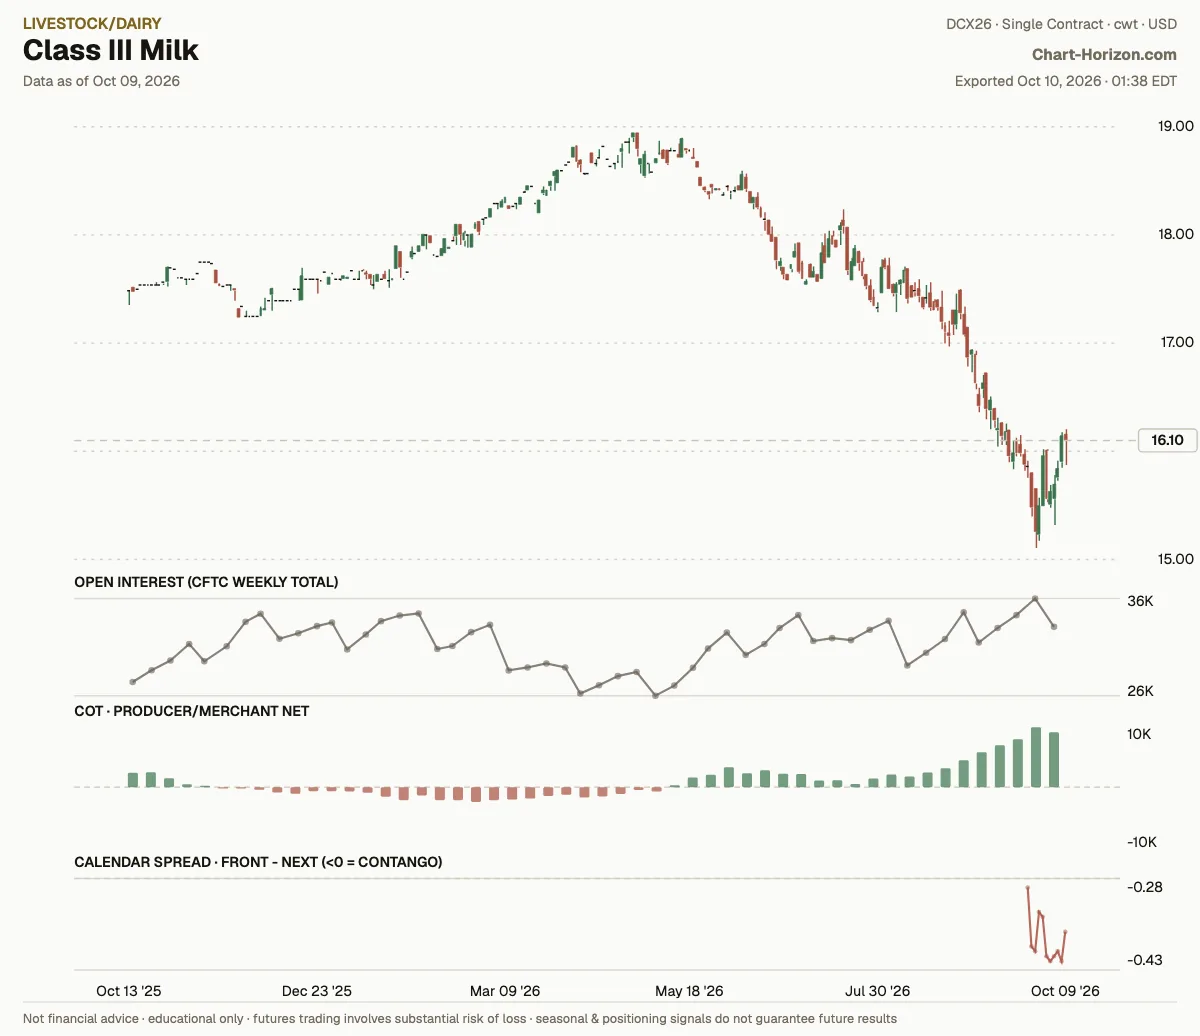
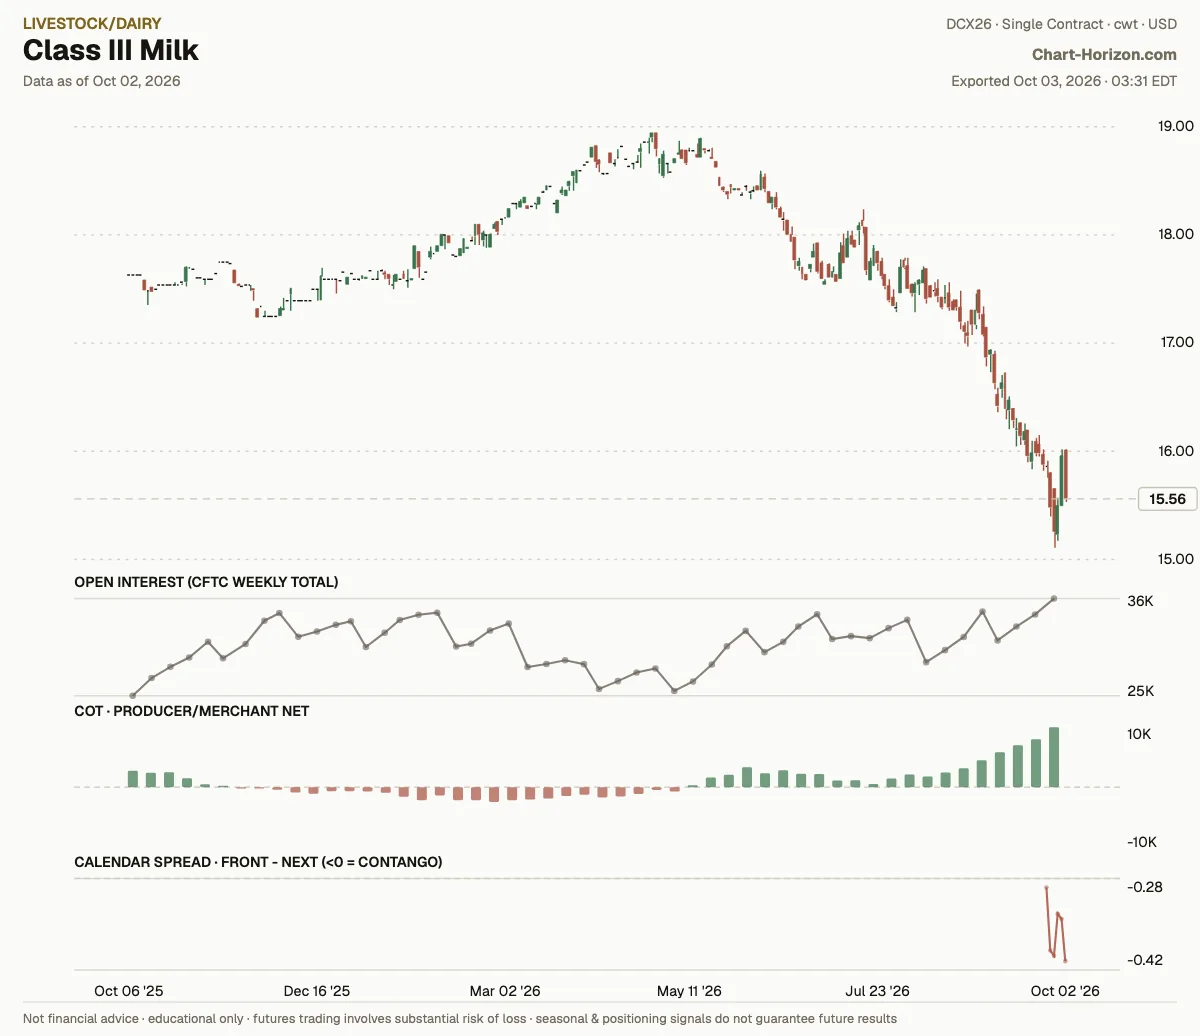
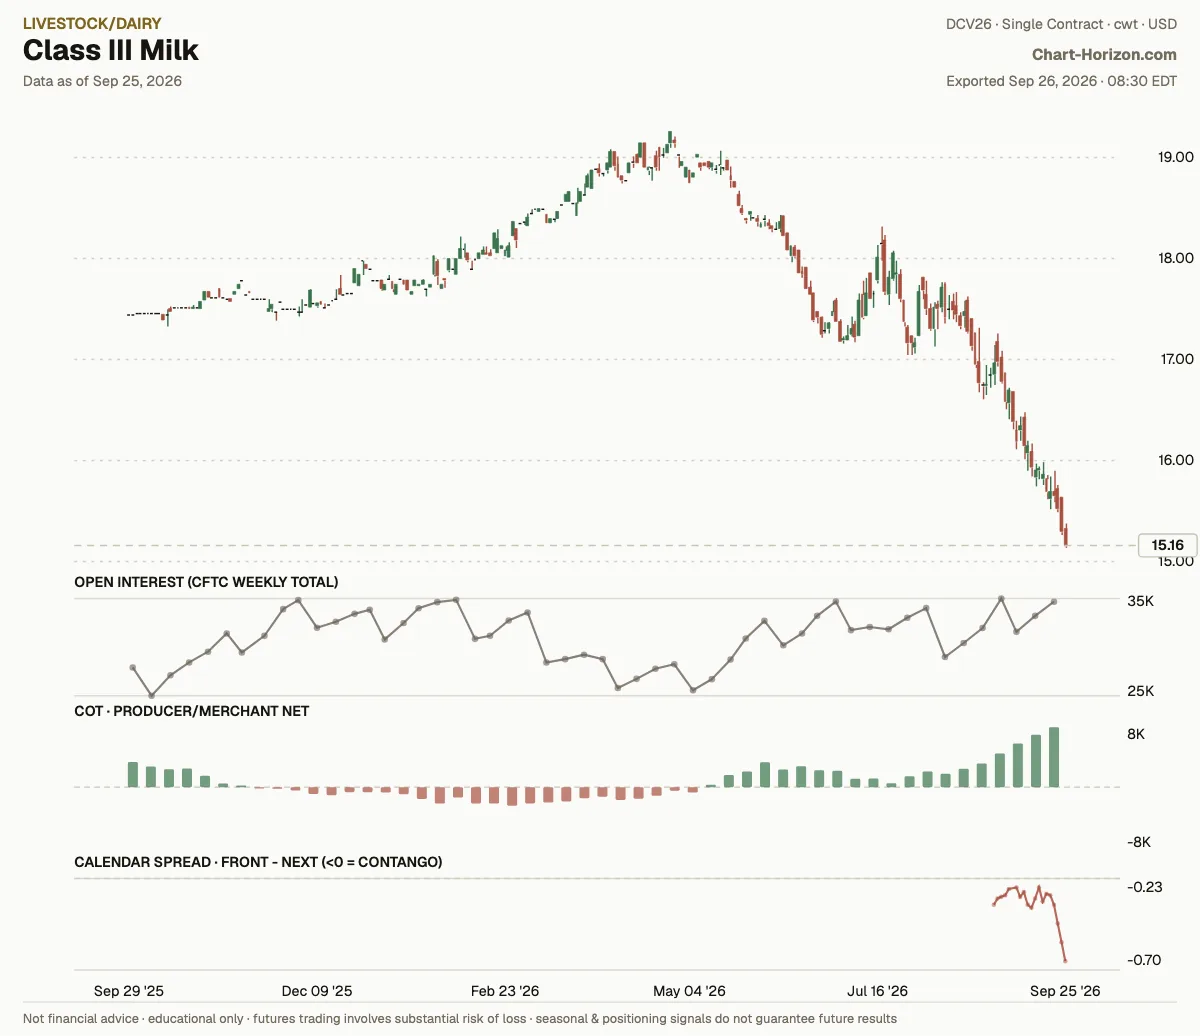
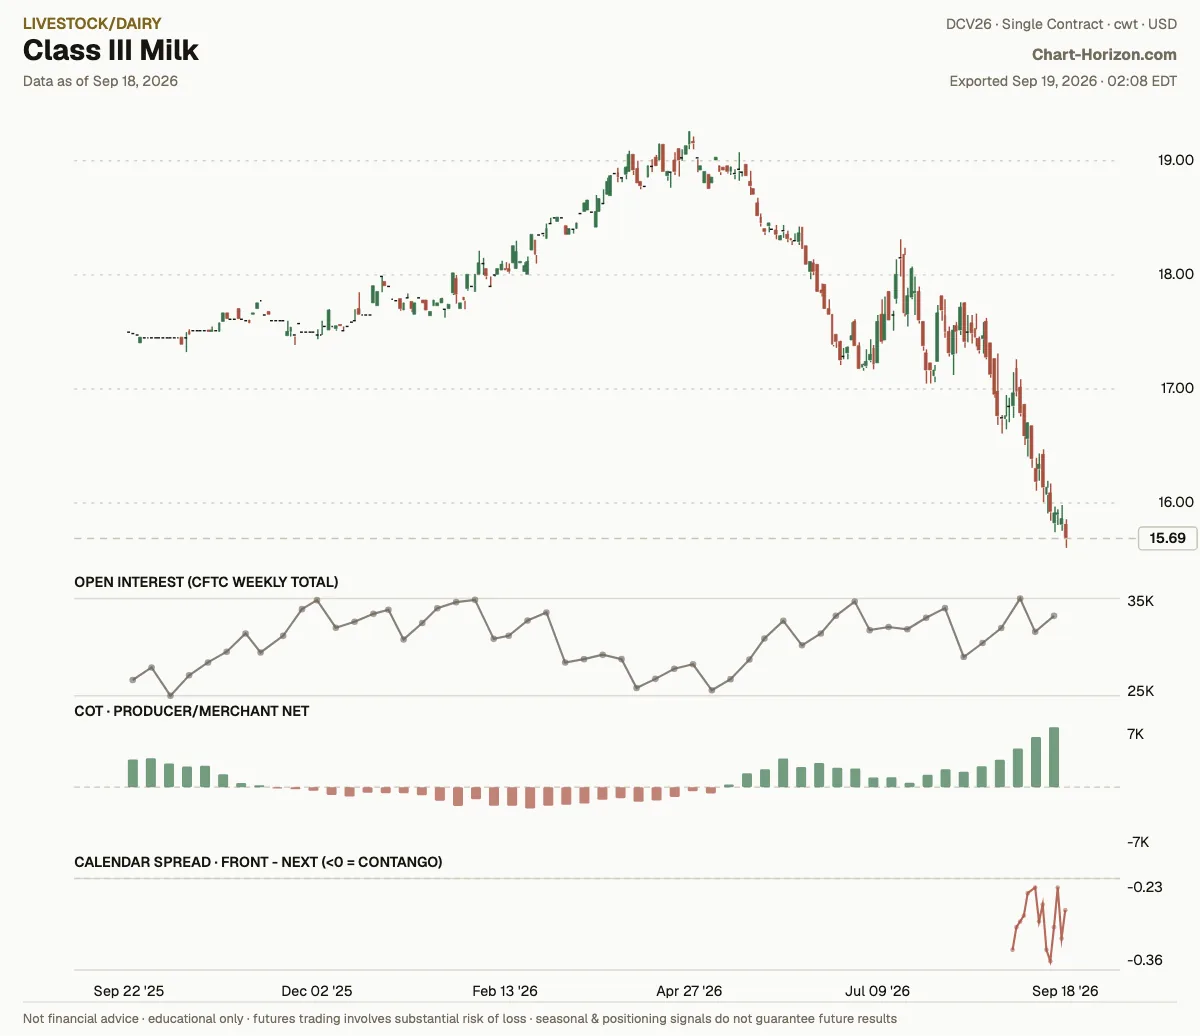
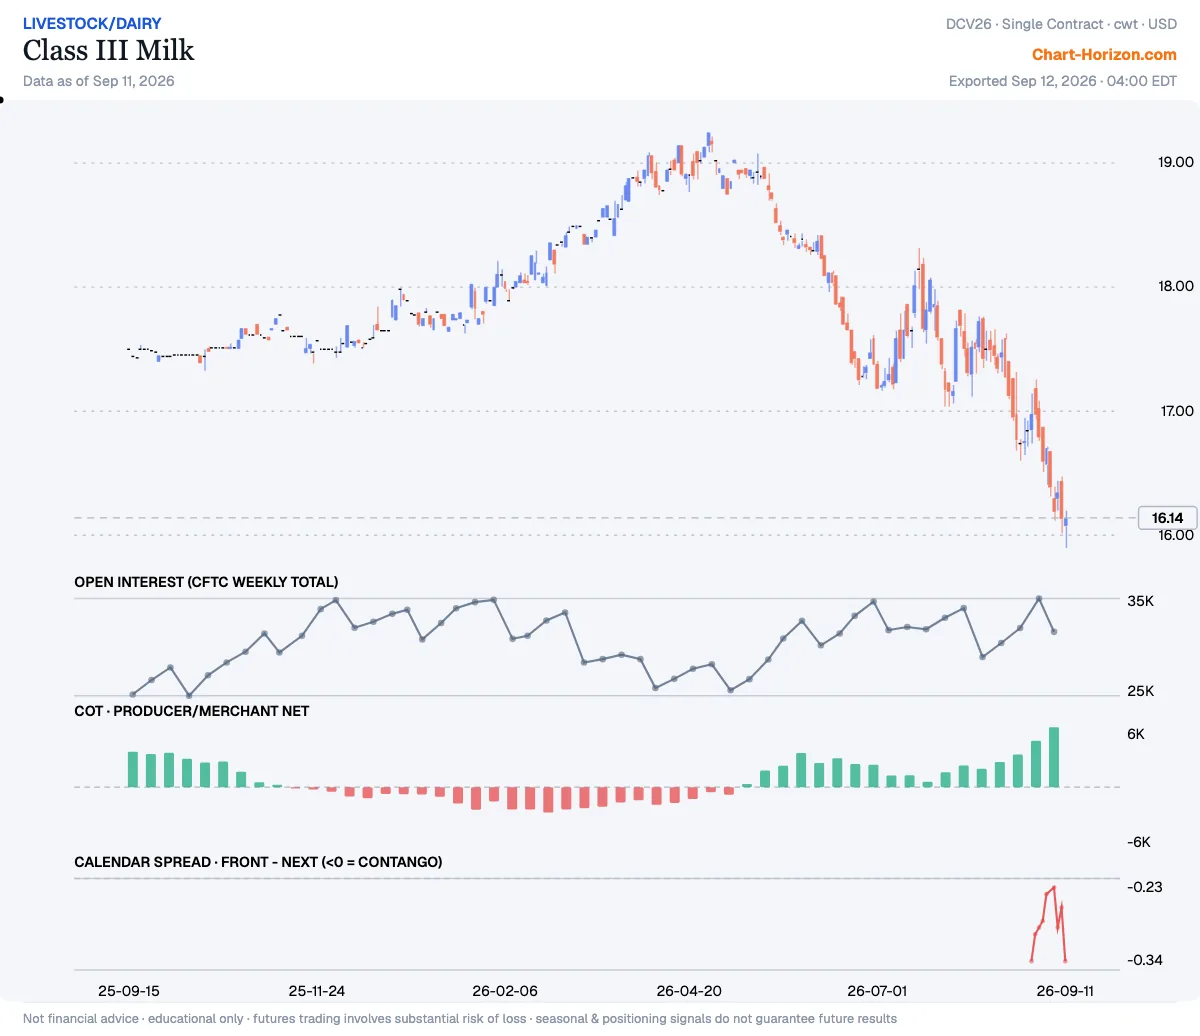
Class III Milk: commercials at a 3-year high
Producer/Merchant Net sits at the 99th percentile of its ~3-year range. The commercials have been heavy net buyers. Net: +9,537 contracts (as of 2026-10-06).
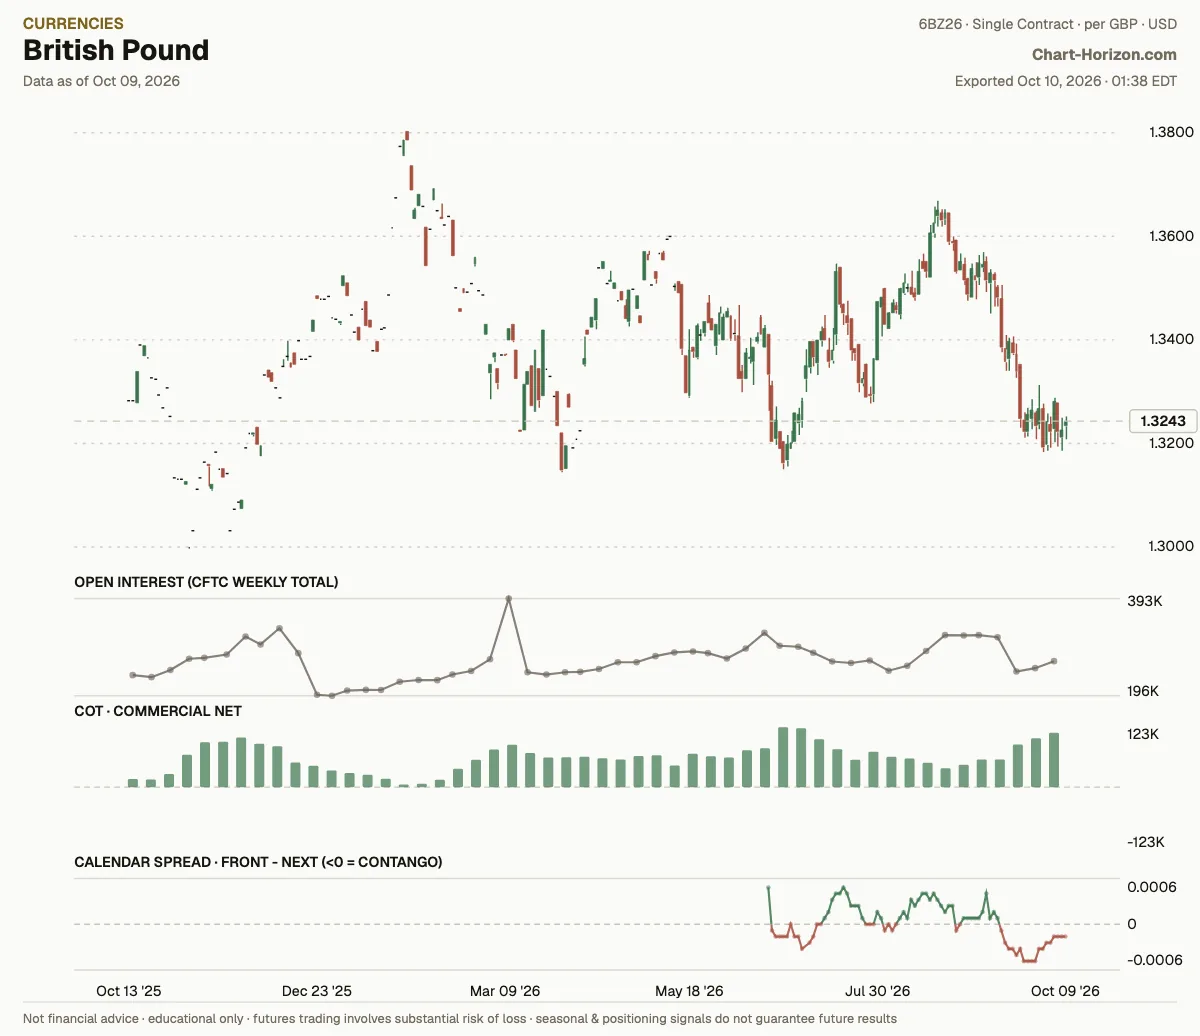
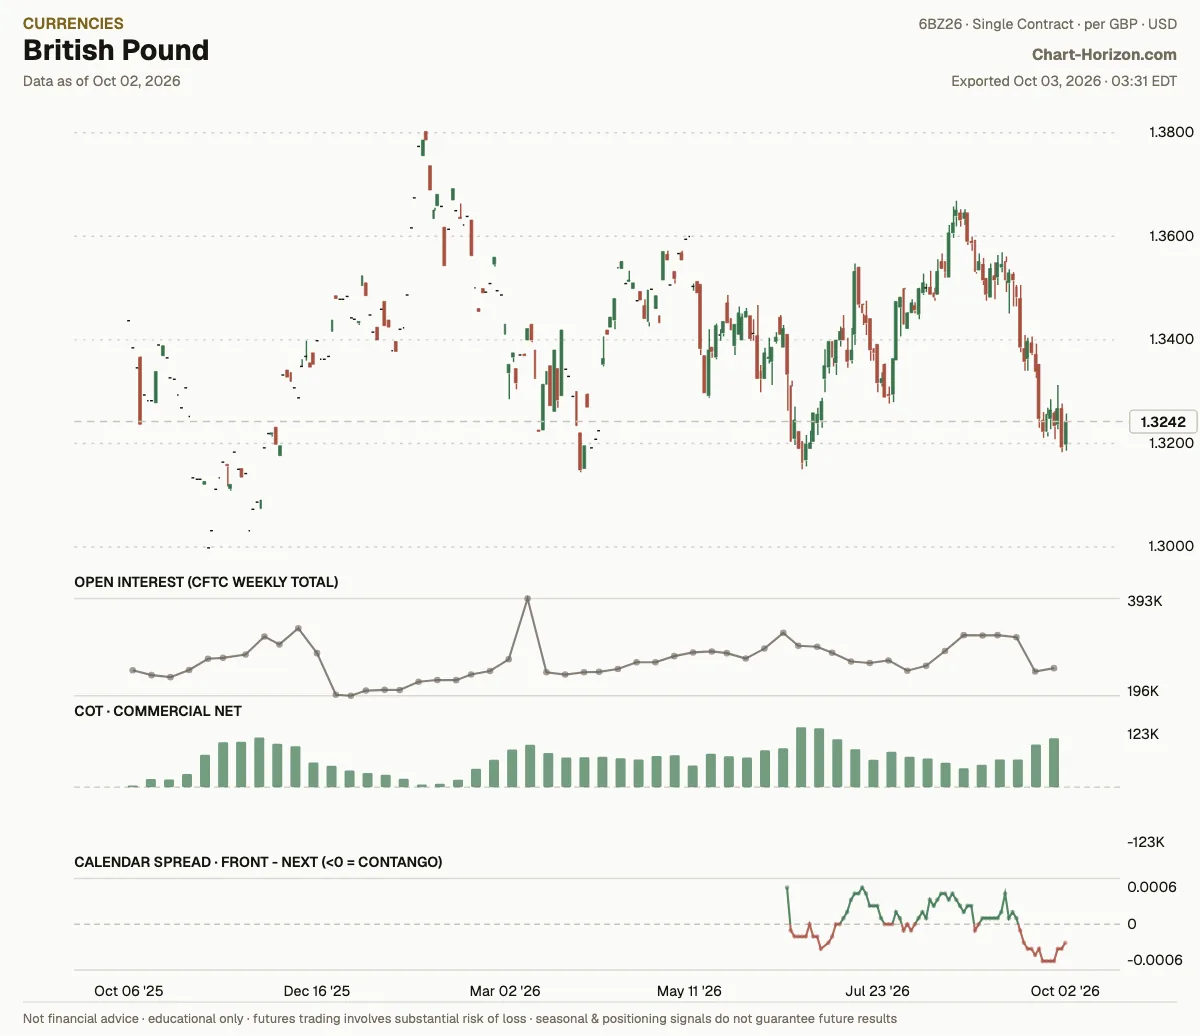
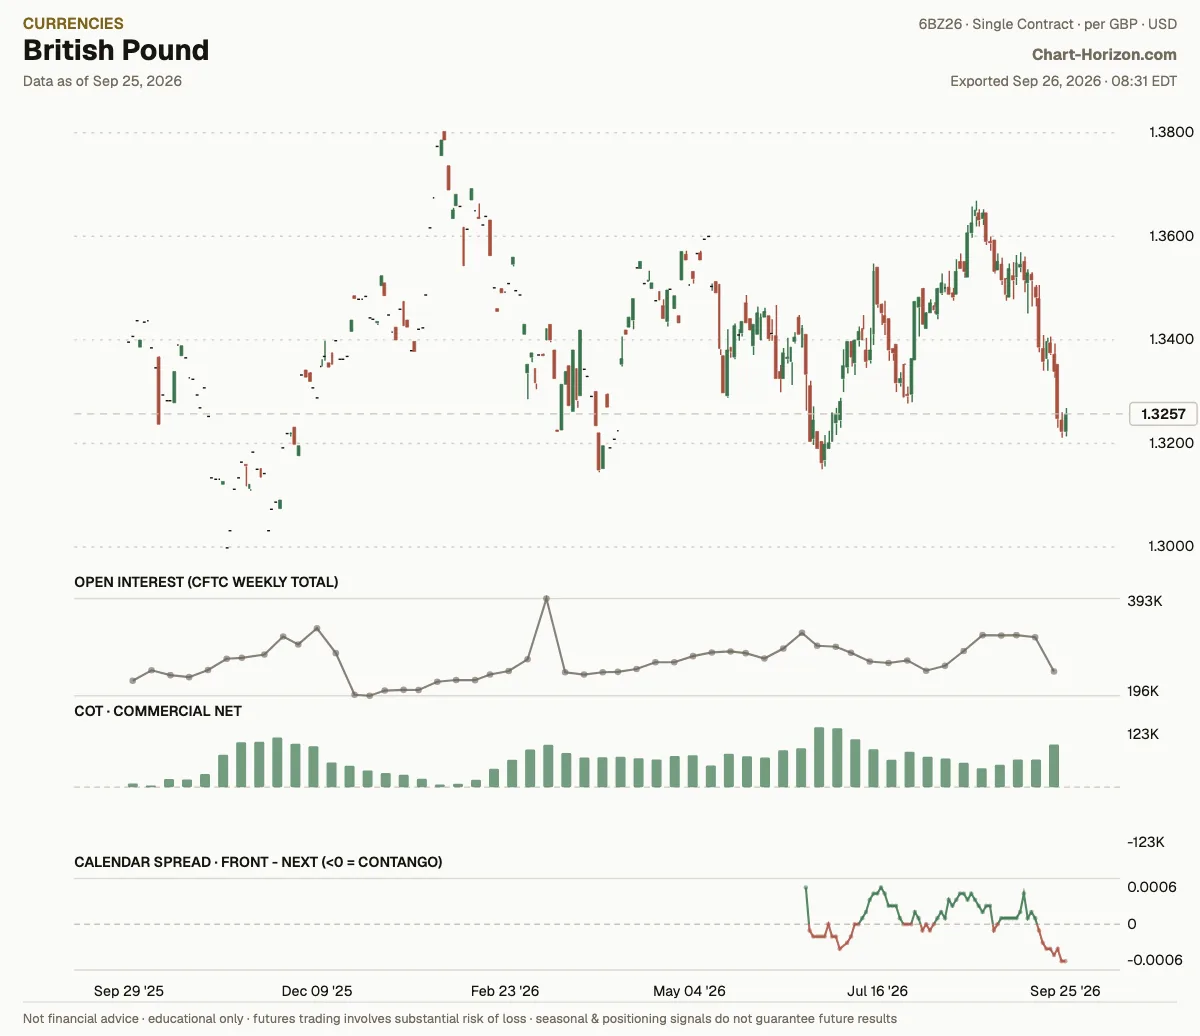
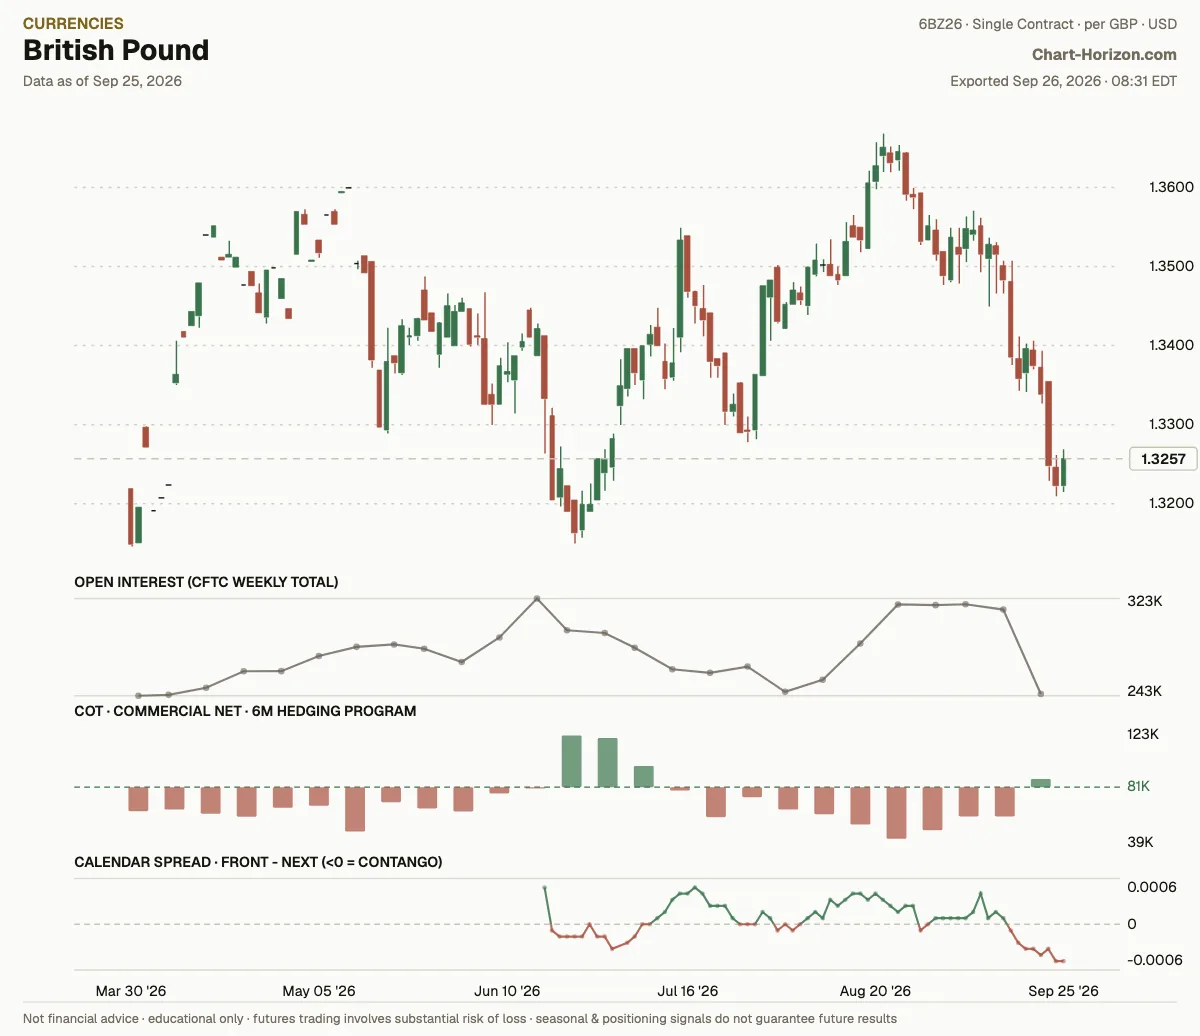
British Pound: commercials at a 3-year high
Commercial Net sits at the 99th percentile of its ~3-year range. The commercials have been heavy net buyers. Net: +111,867 contracts (as of 2026-10-06).
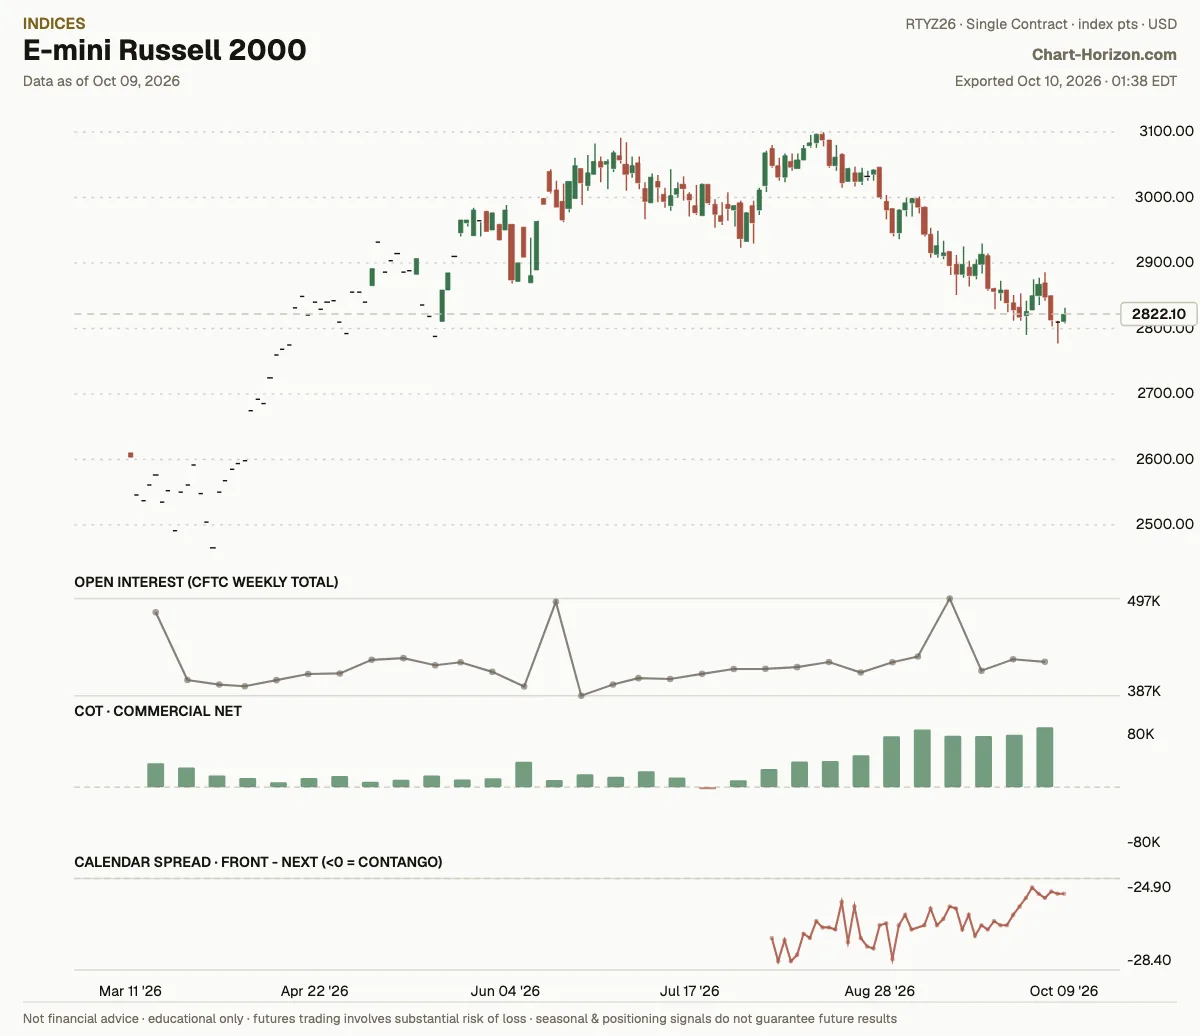
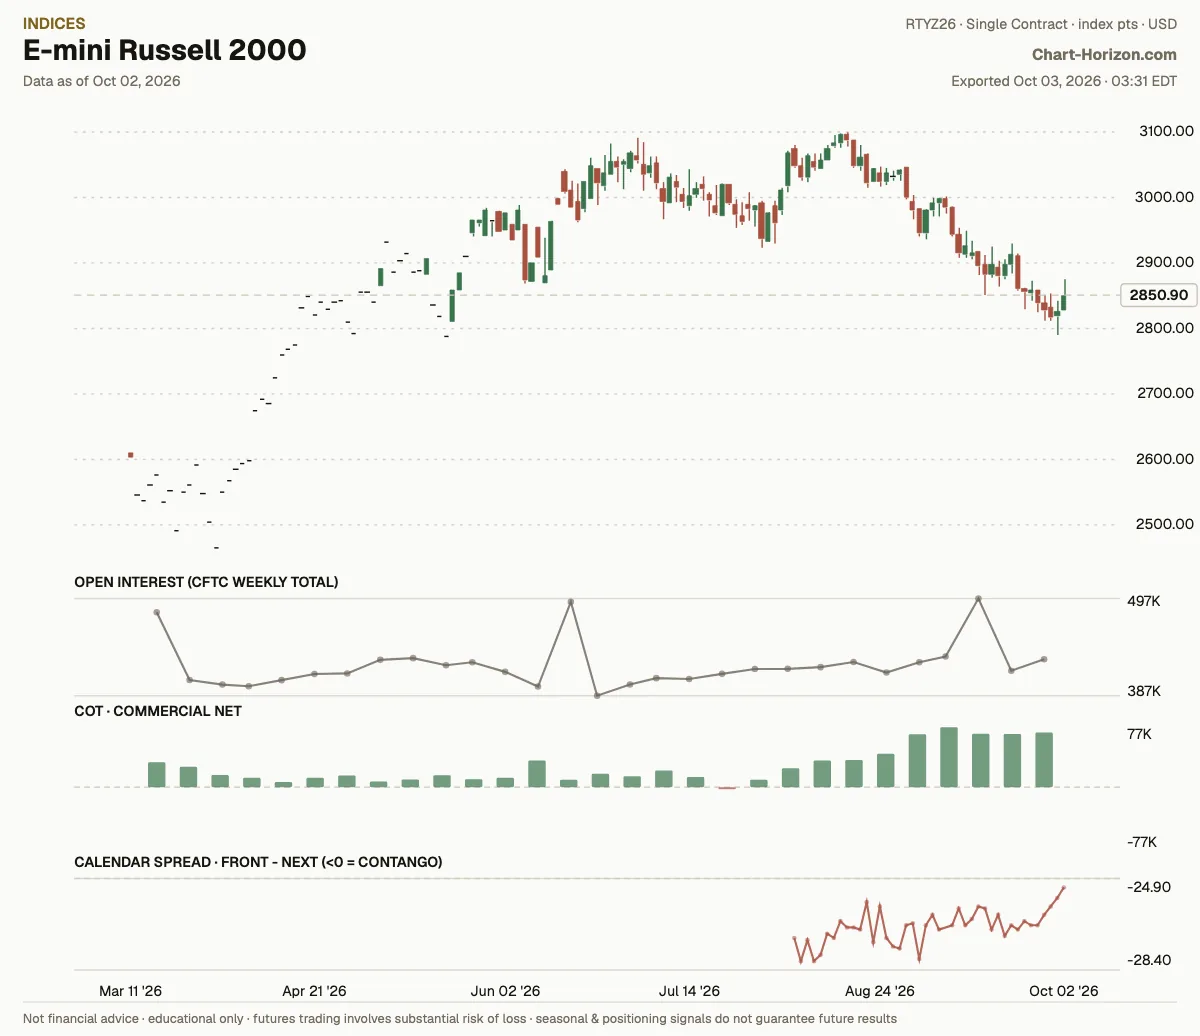
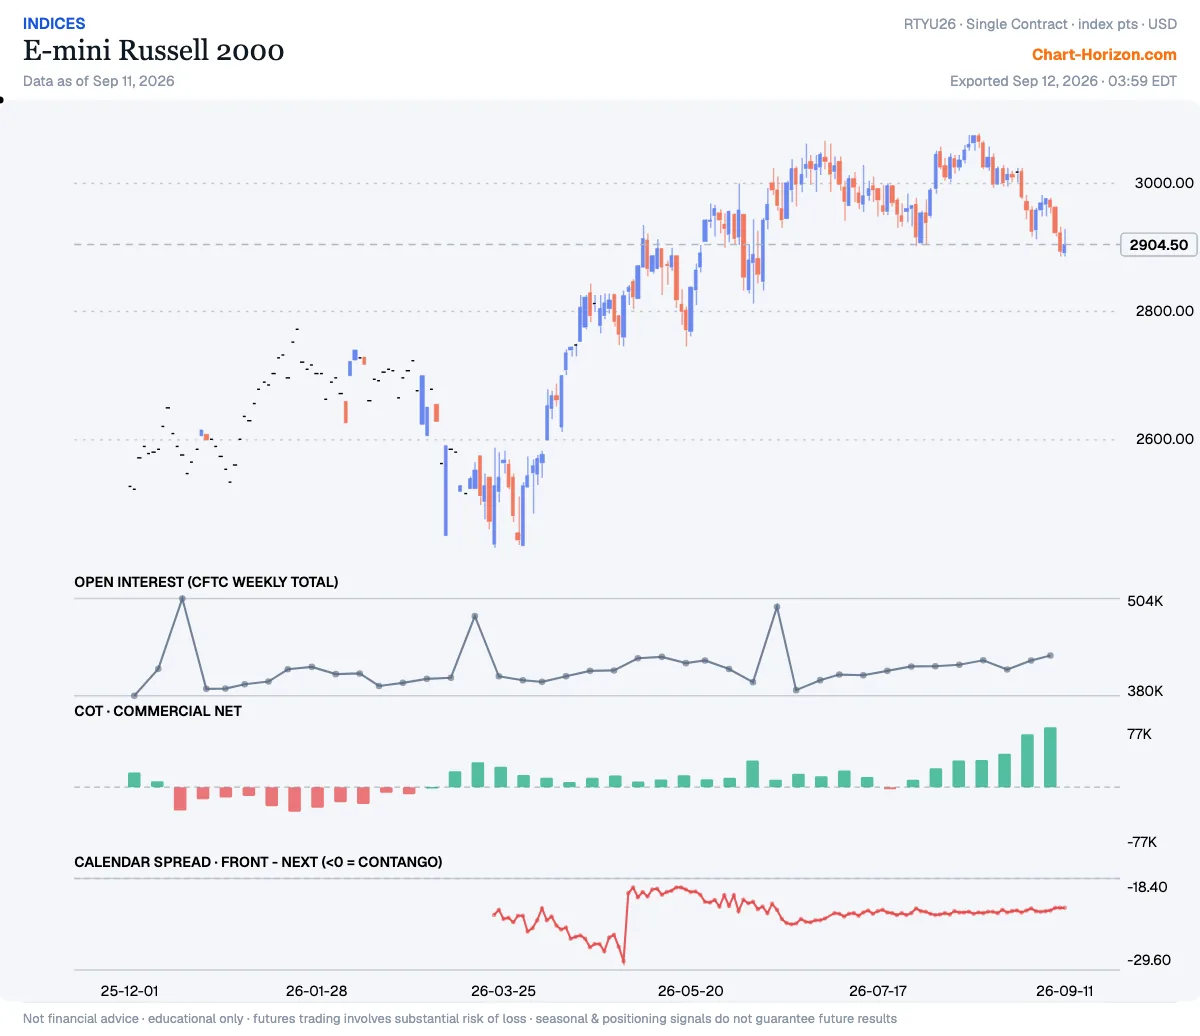
E-mini Russell 2000: commercials at a 3-year high
Commercial Net sits at the 99th percentile of its ~3-year range. The commercials have been heavy net buyers. Net: +80,284 contracts (as of 2026-10-06).
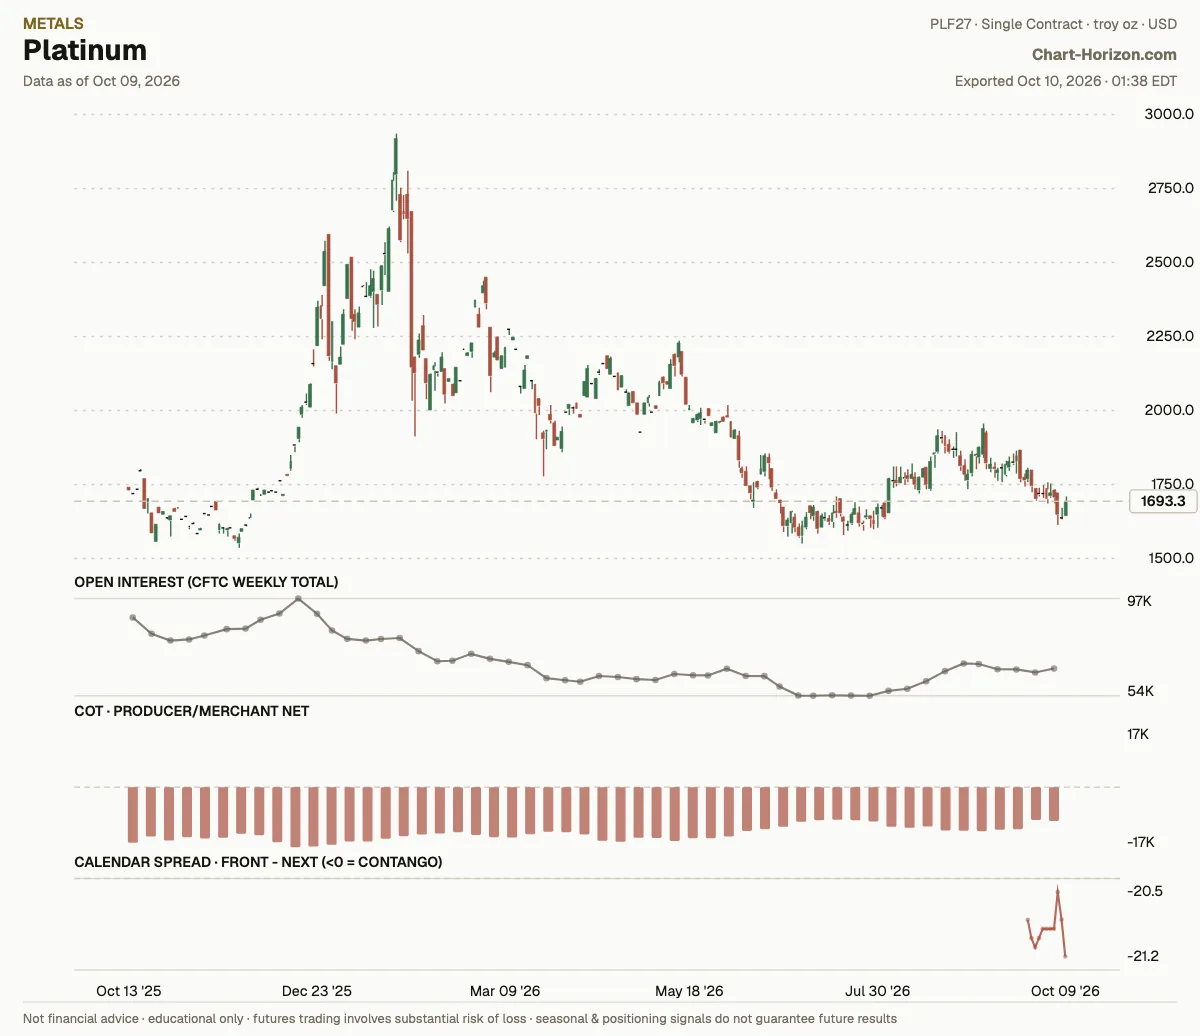
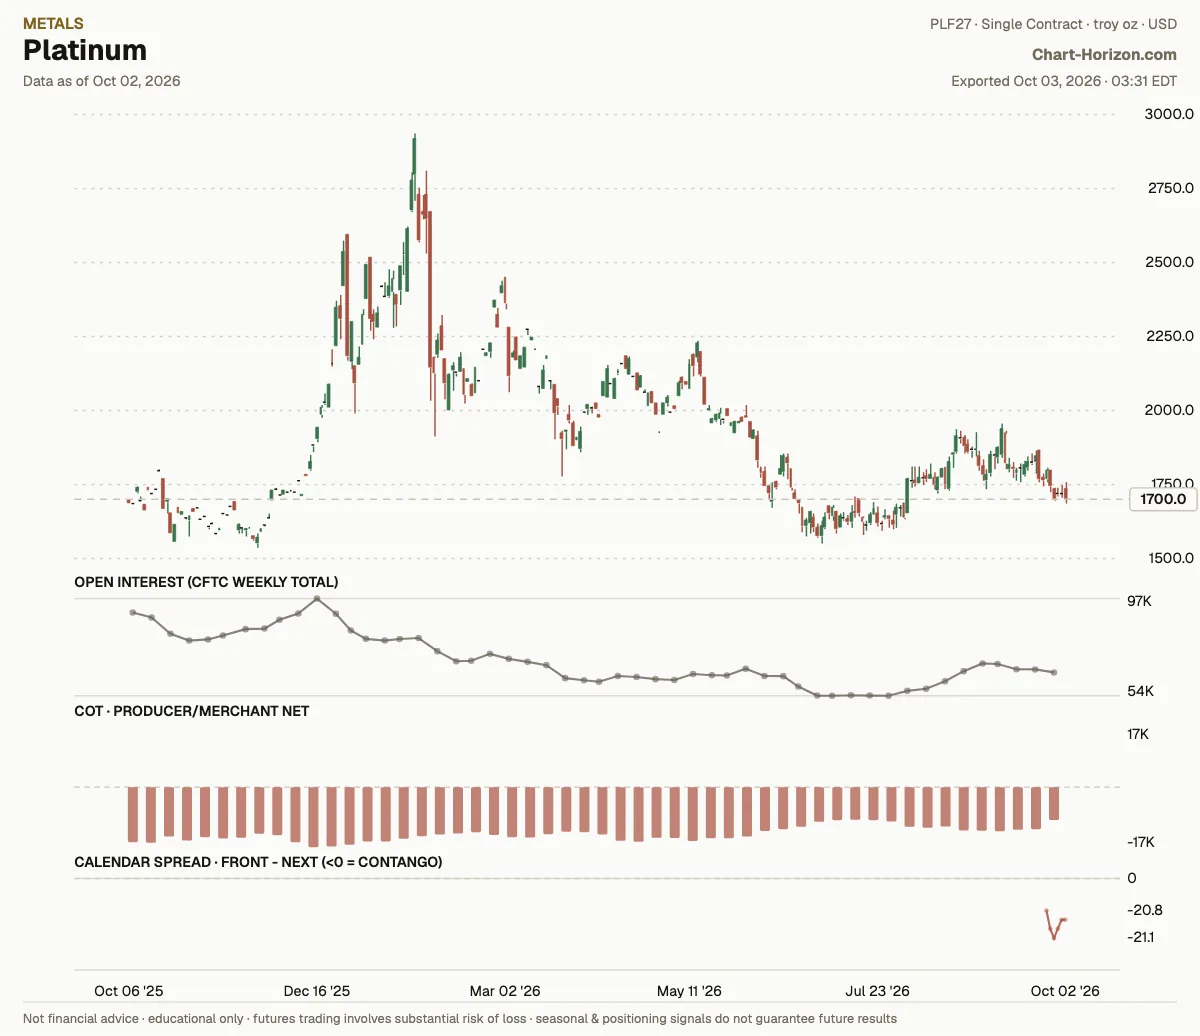
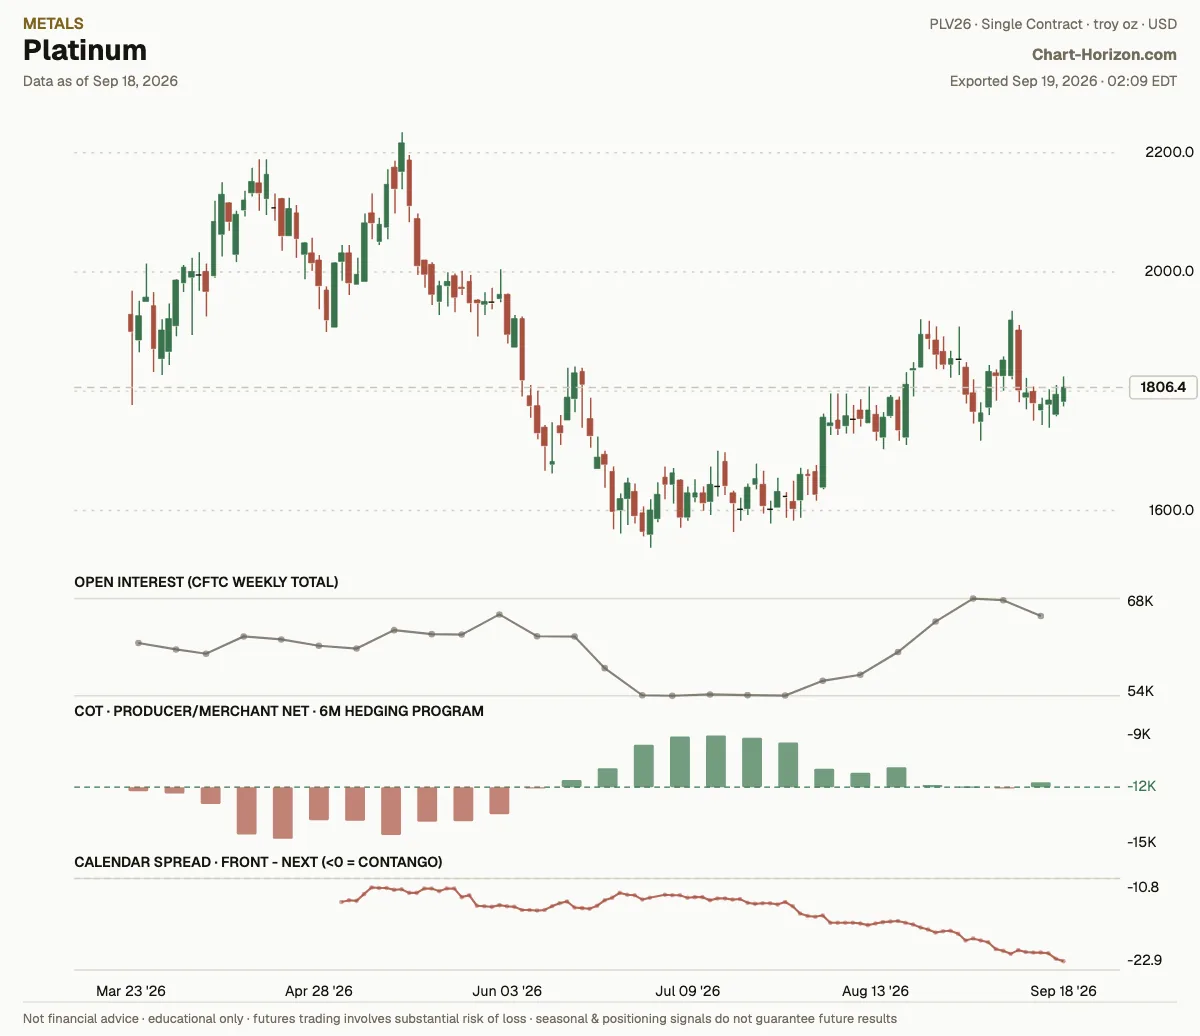
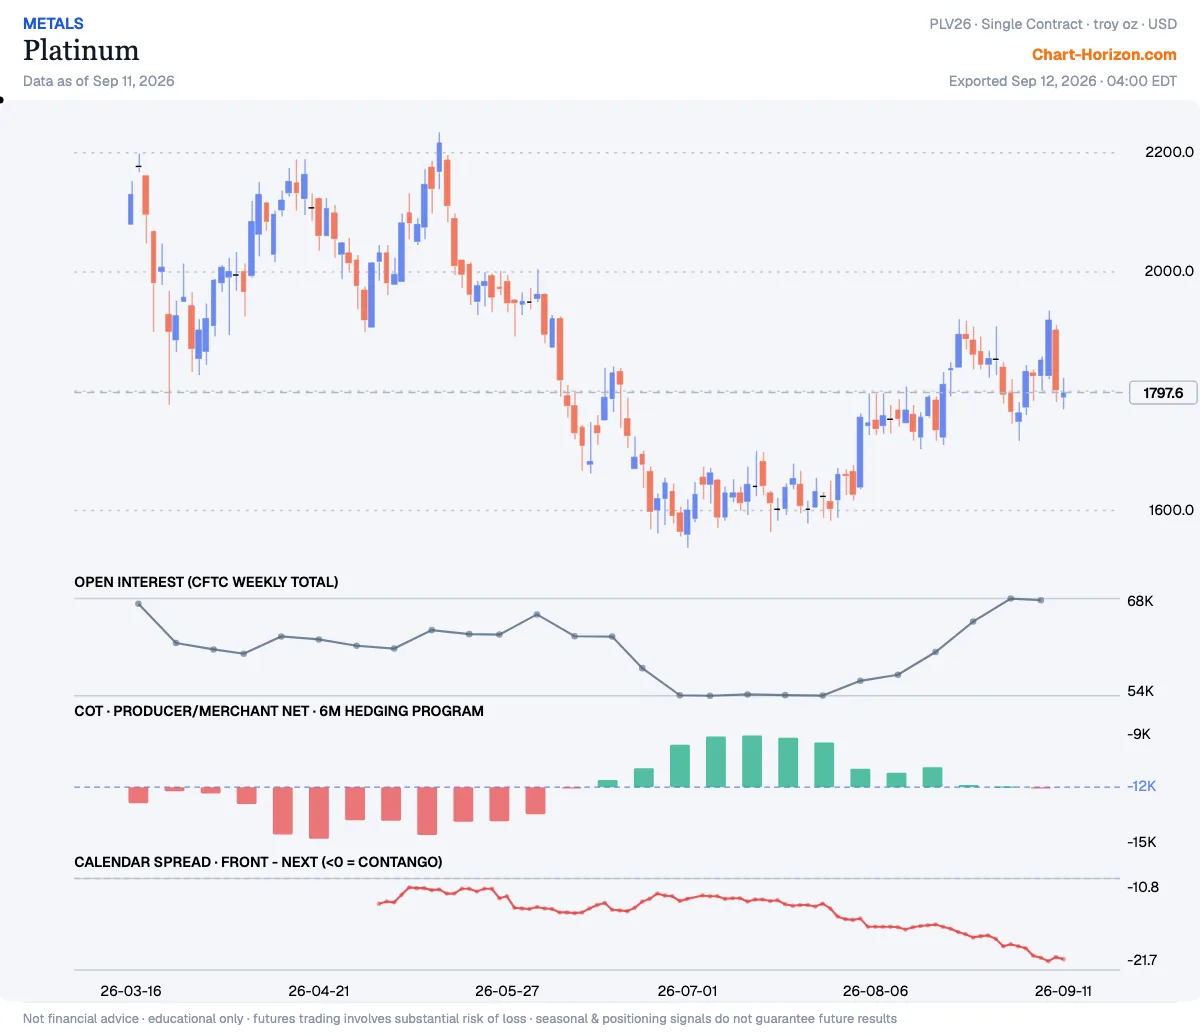
Platinum: commercials at a 3-year high
Producer/Merchant Net sits at the 97th percentile of its ~3-year range. The commercials have covered shorts toward the least-short end of the window; the book is still net short. Net: -9,484 contracts (as of 2026-10-06).
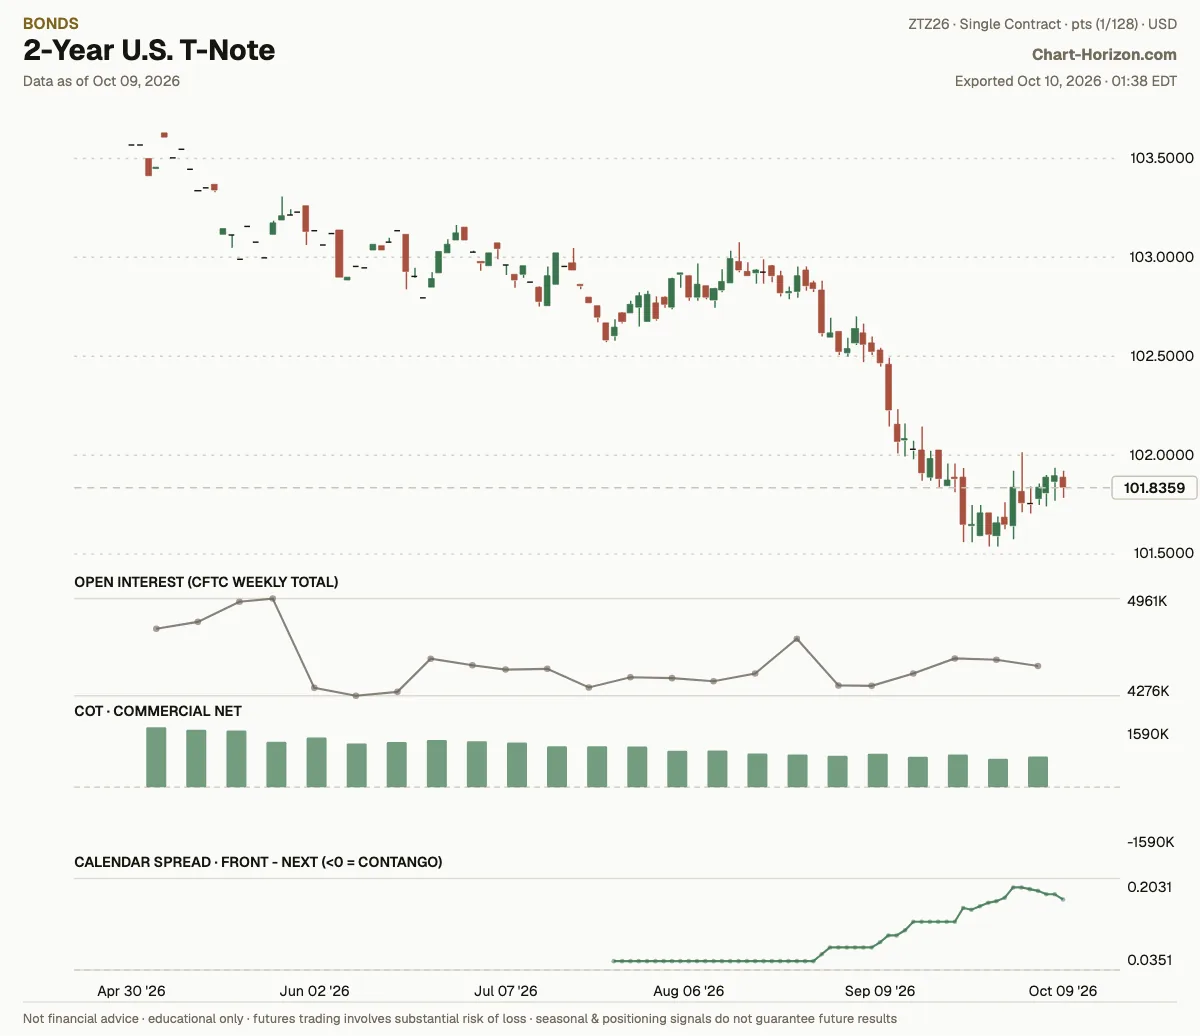
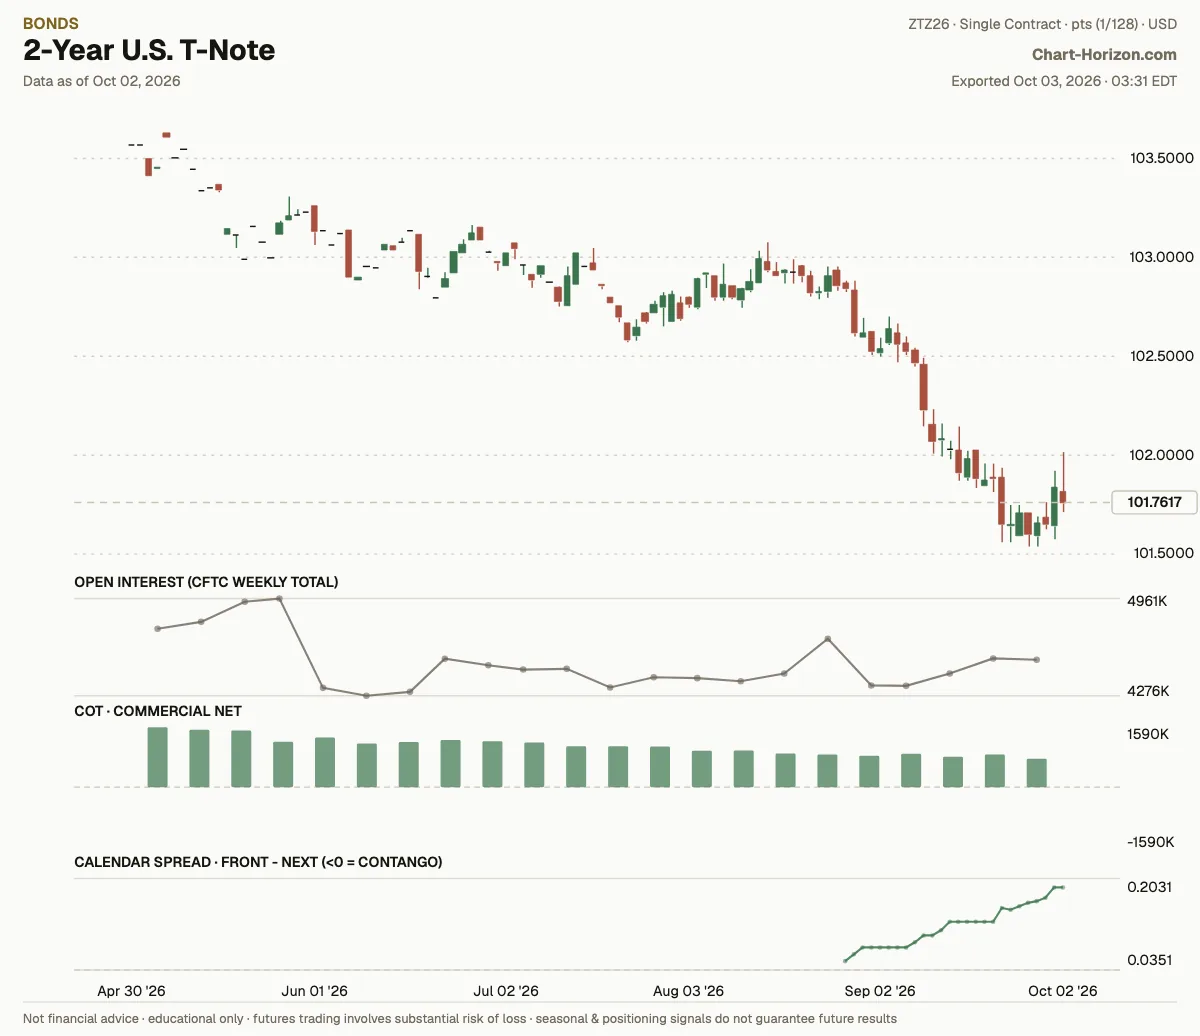
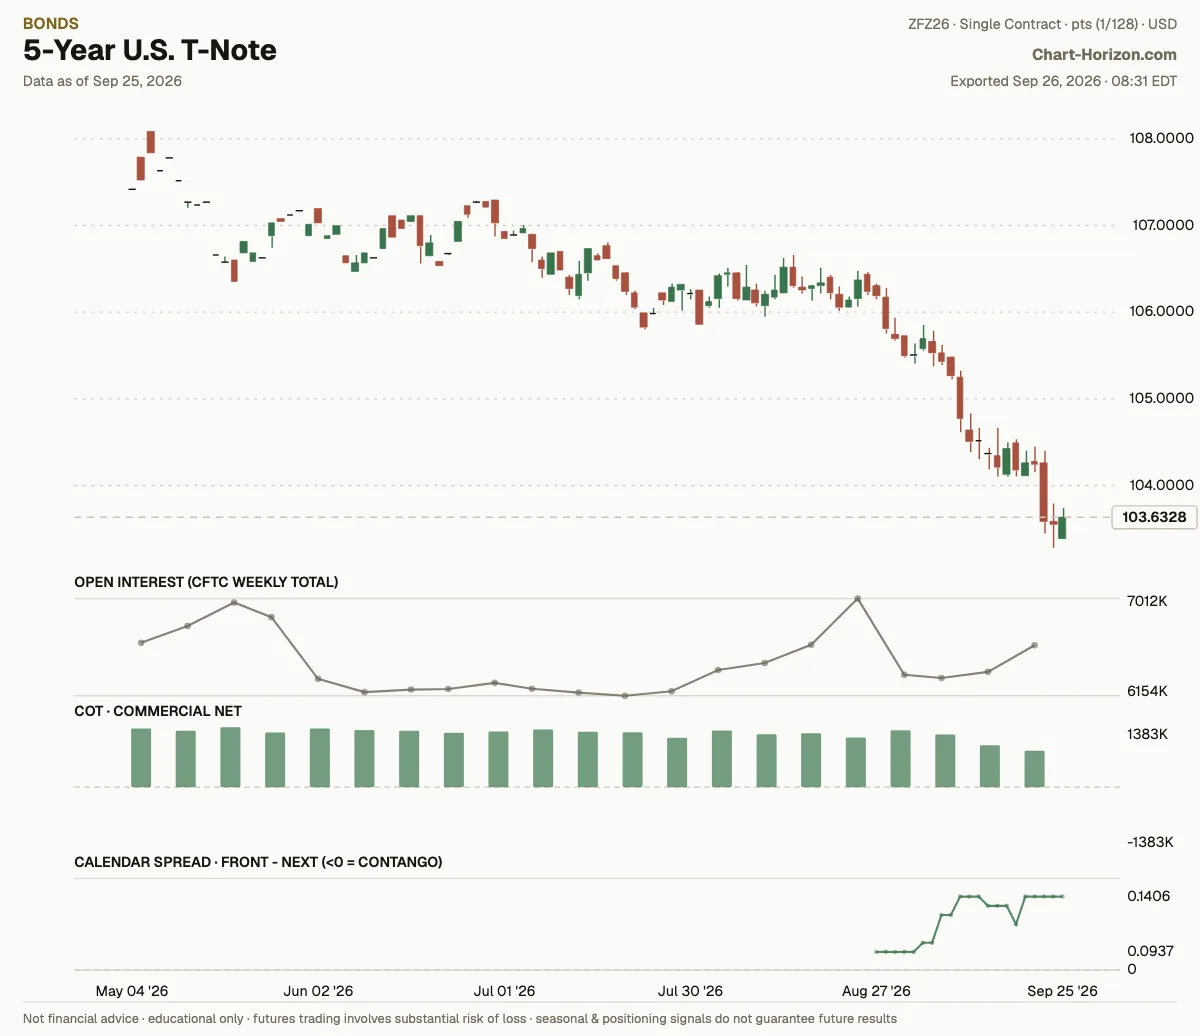
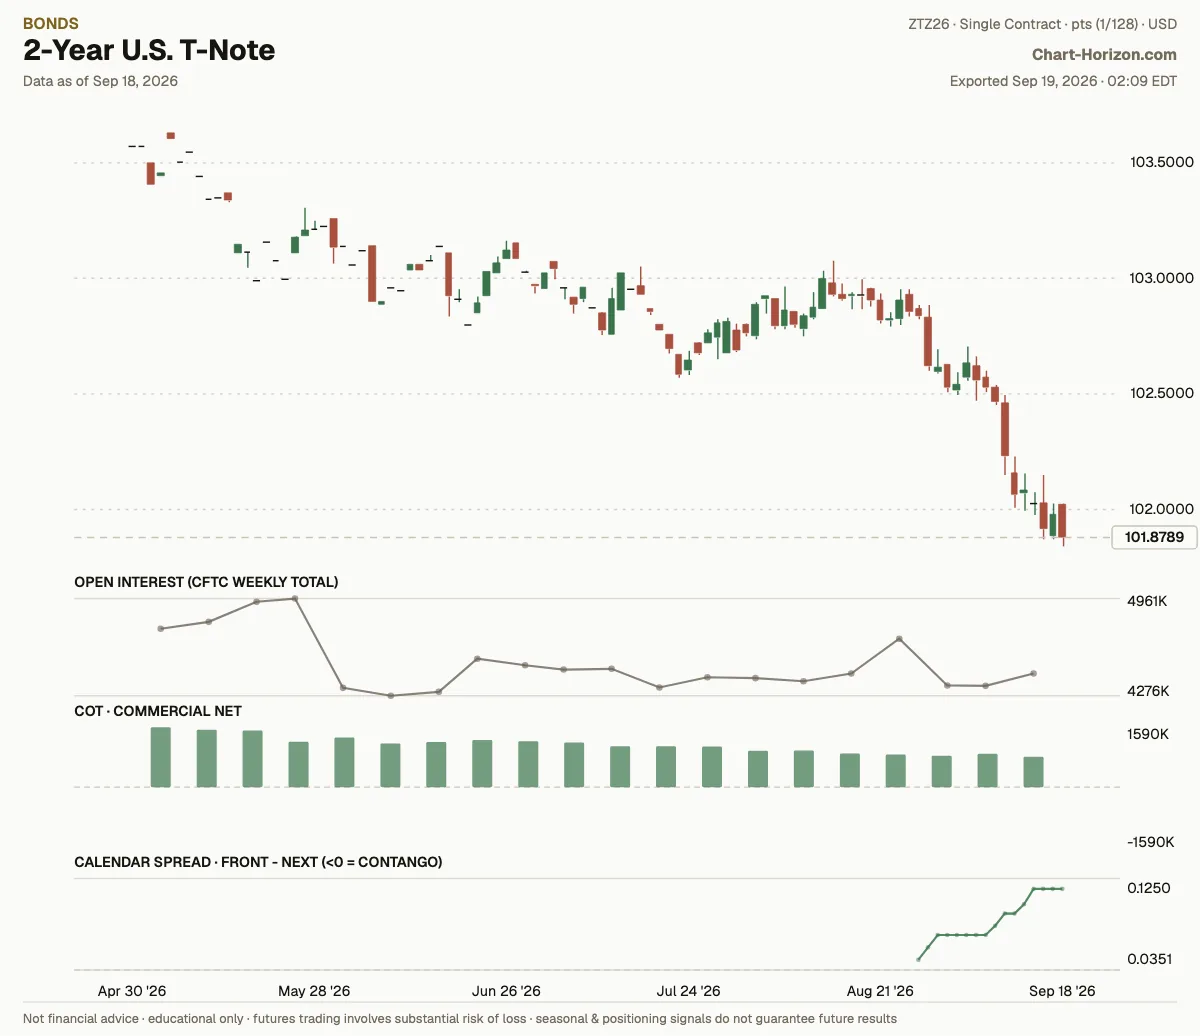
2-Year U.S. T-Note: commercials at a 3-year low
Commercial Net sits at the 4th percentile of its ~3-year range. The commercials have shed longs toward the least-long end of the window; the book is still net long. Net: +809,853 contracts (as of 2026-10-06).
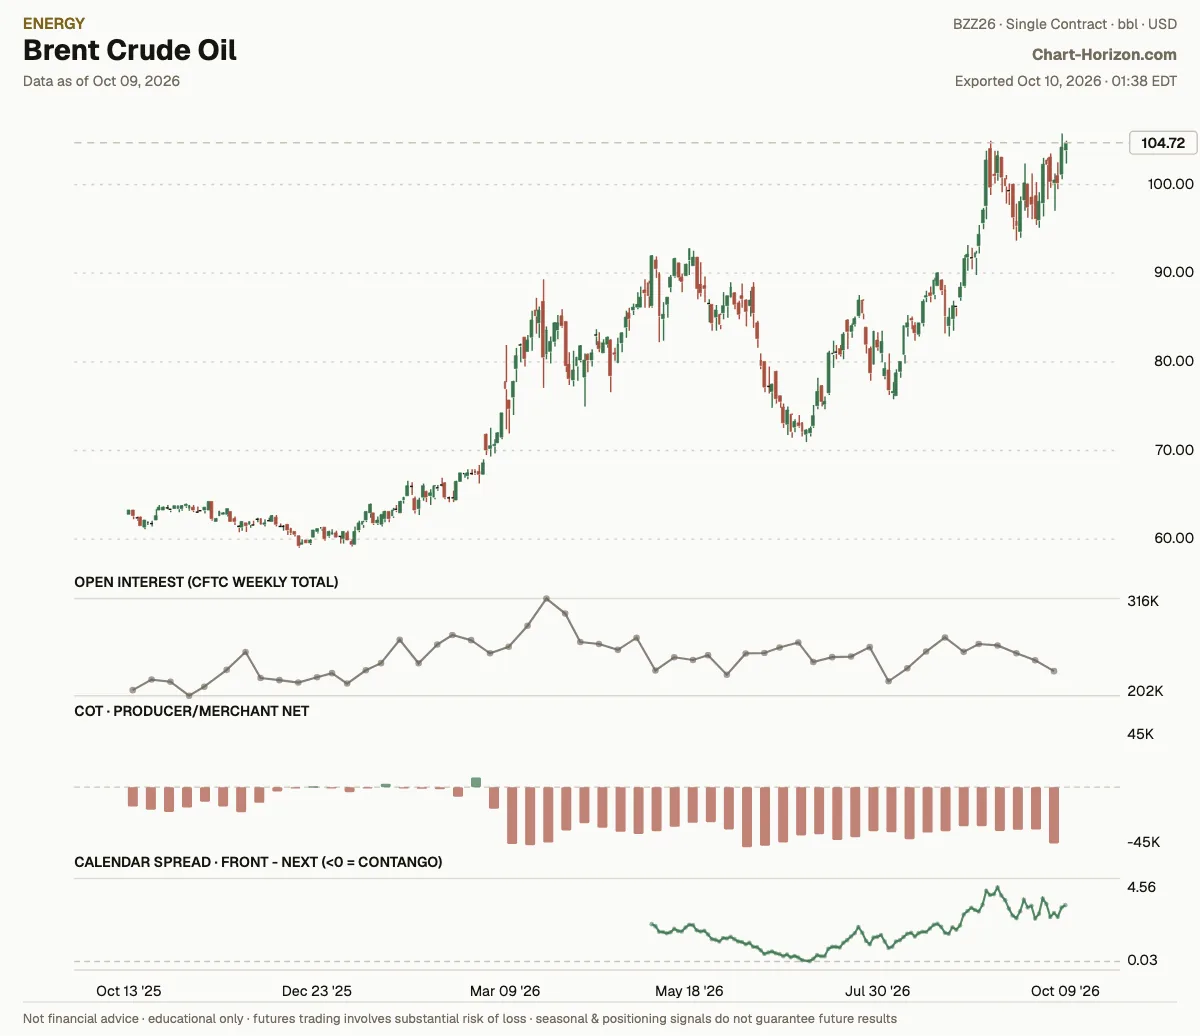
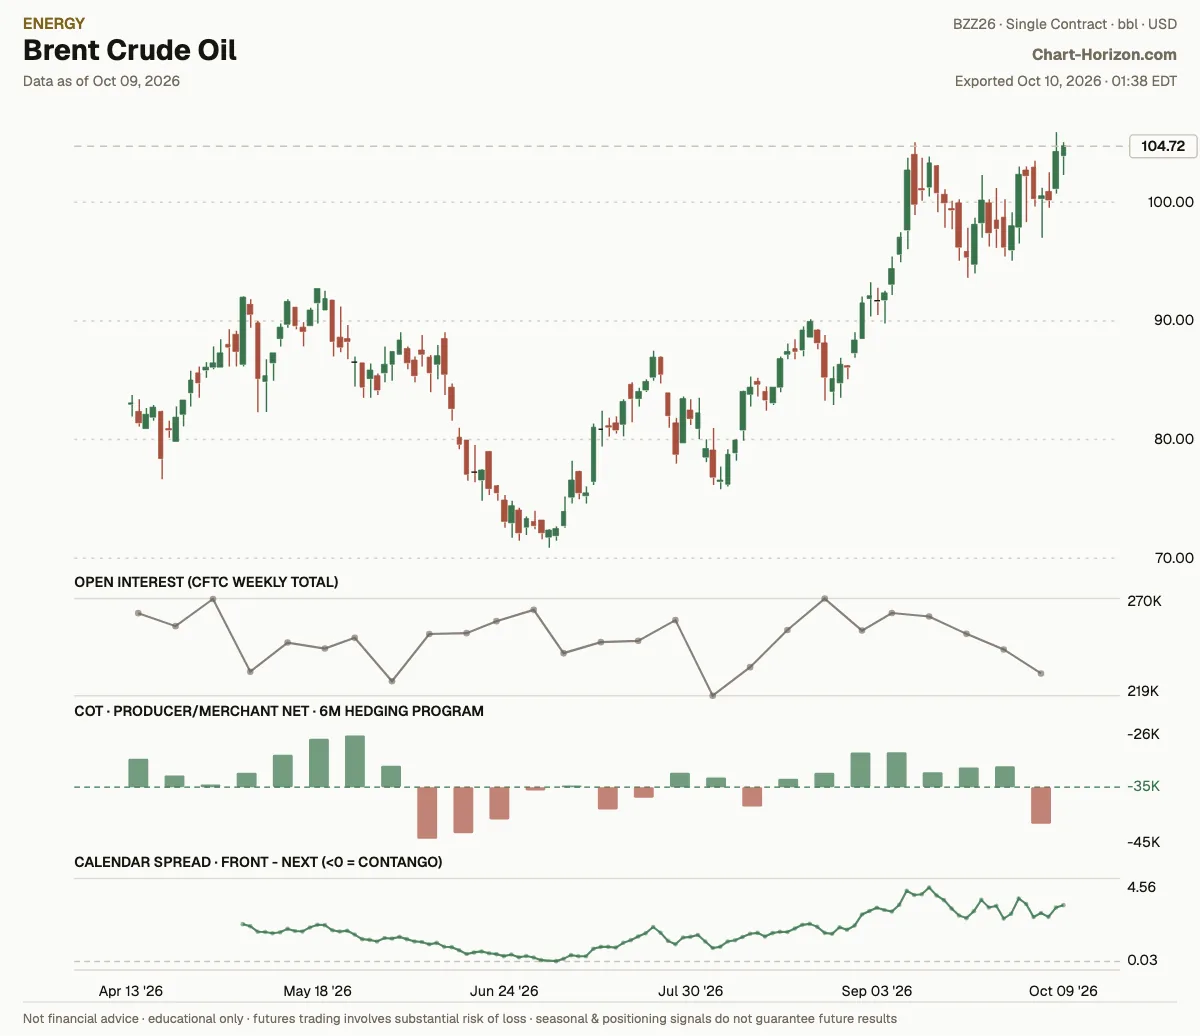
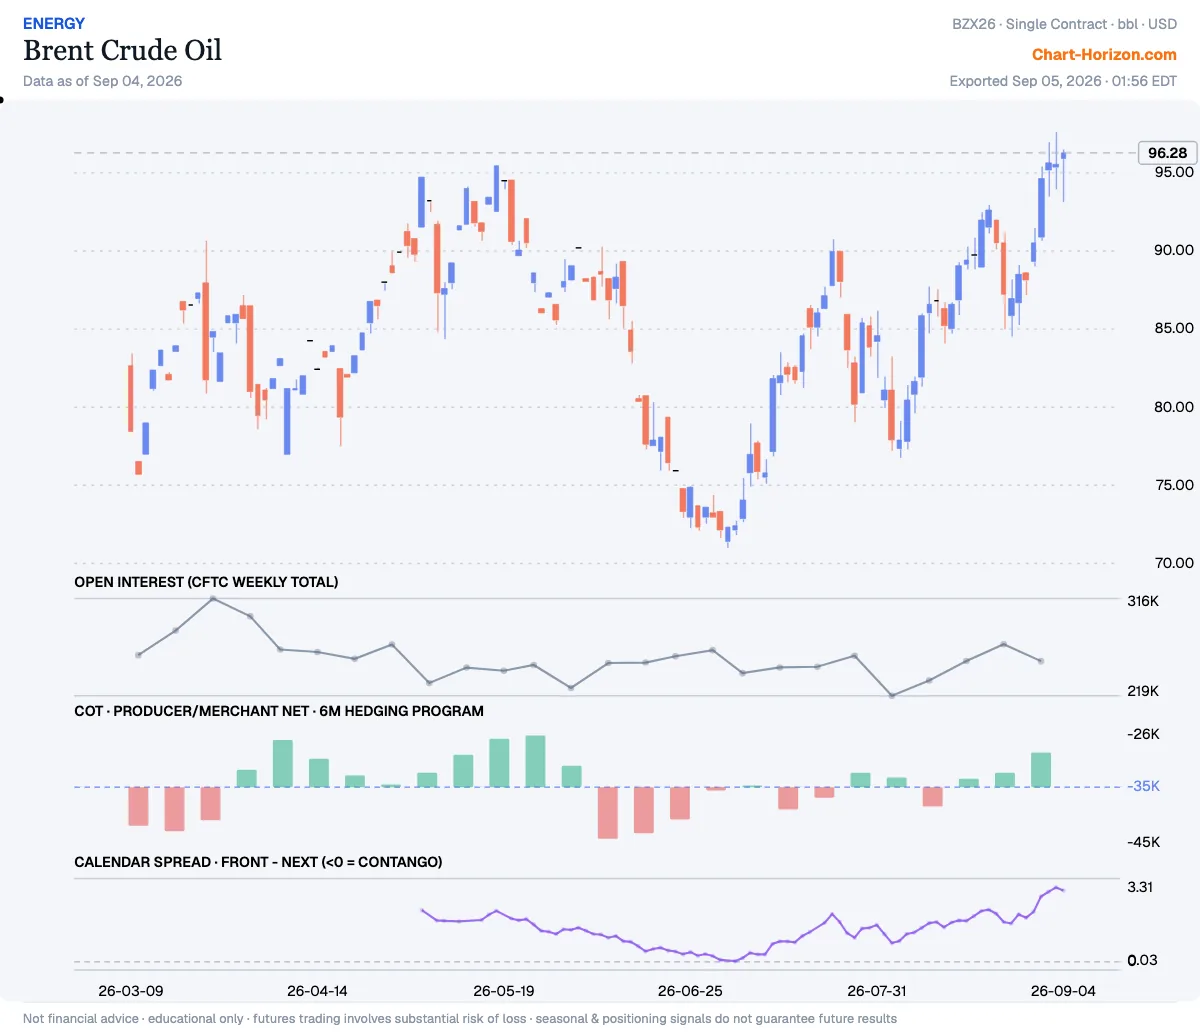
Brent Crude Oil: commercials at a 3-year low
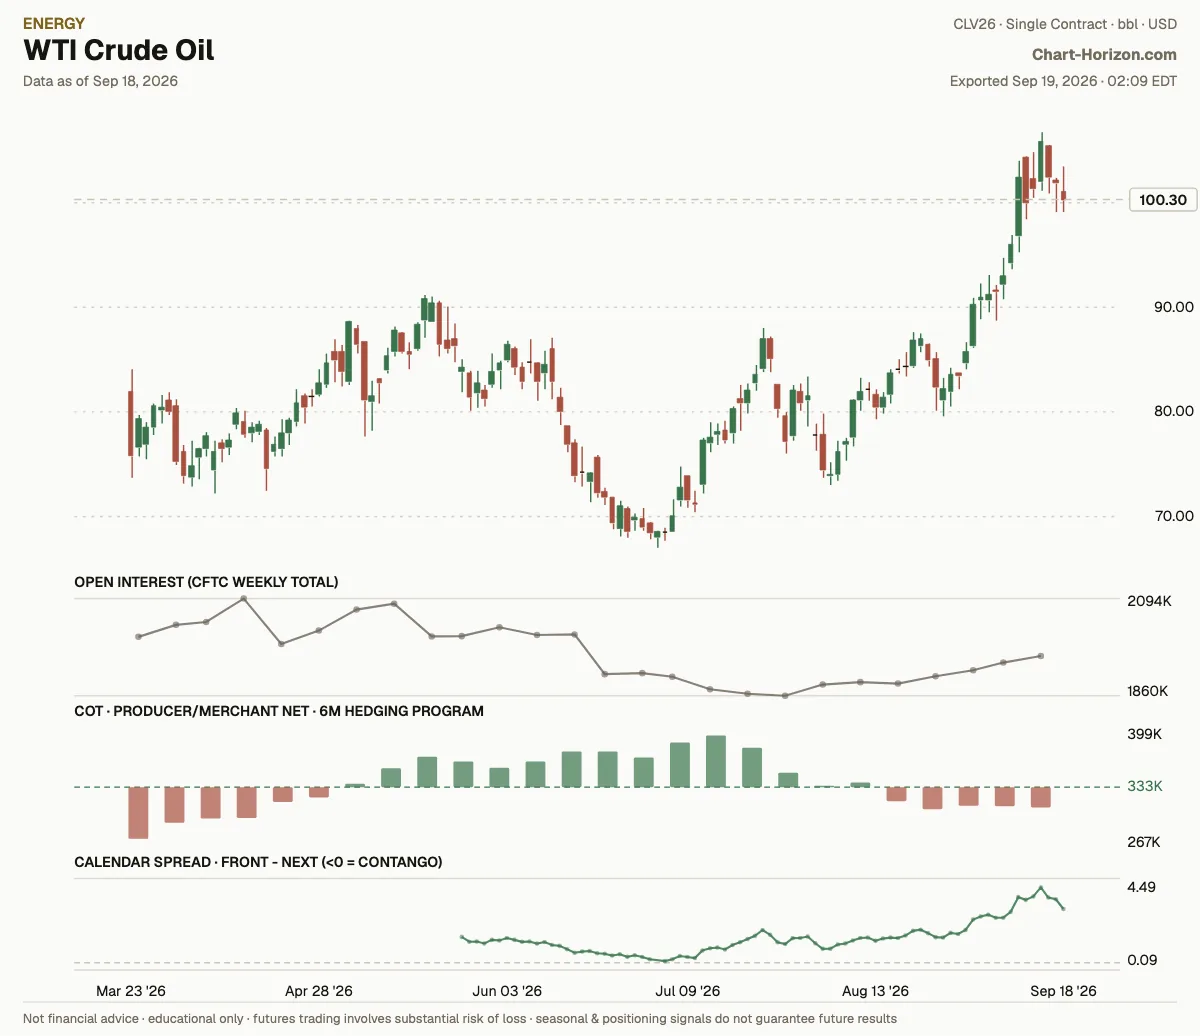
Producer/Merchant Net sits at the 4th percentile of its ~3-year range. The commercials have been heavy net sellers. Net: -41,789 contracts (as of 2026-10-06). New this week.
The hedging program
Where each market’s tracked COT net sits inside its own trailing six-month range: above the midpoint of that range or below it. This is the same positioning read at close quarters, and it answers a different question from the extremes above: a book can sit at a three-year low and still have been working higher for six months. What follows is only what MOVED: the markets that crossed that midpoint with this week’s report.
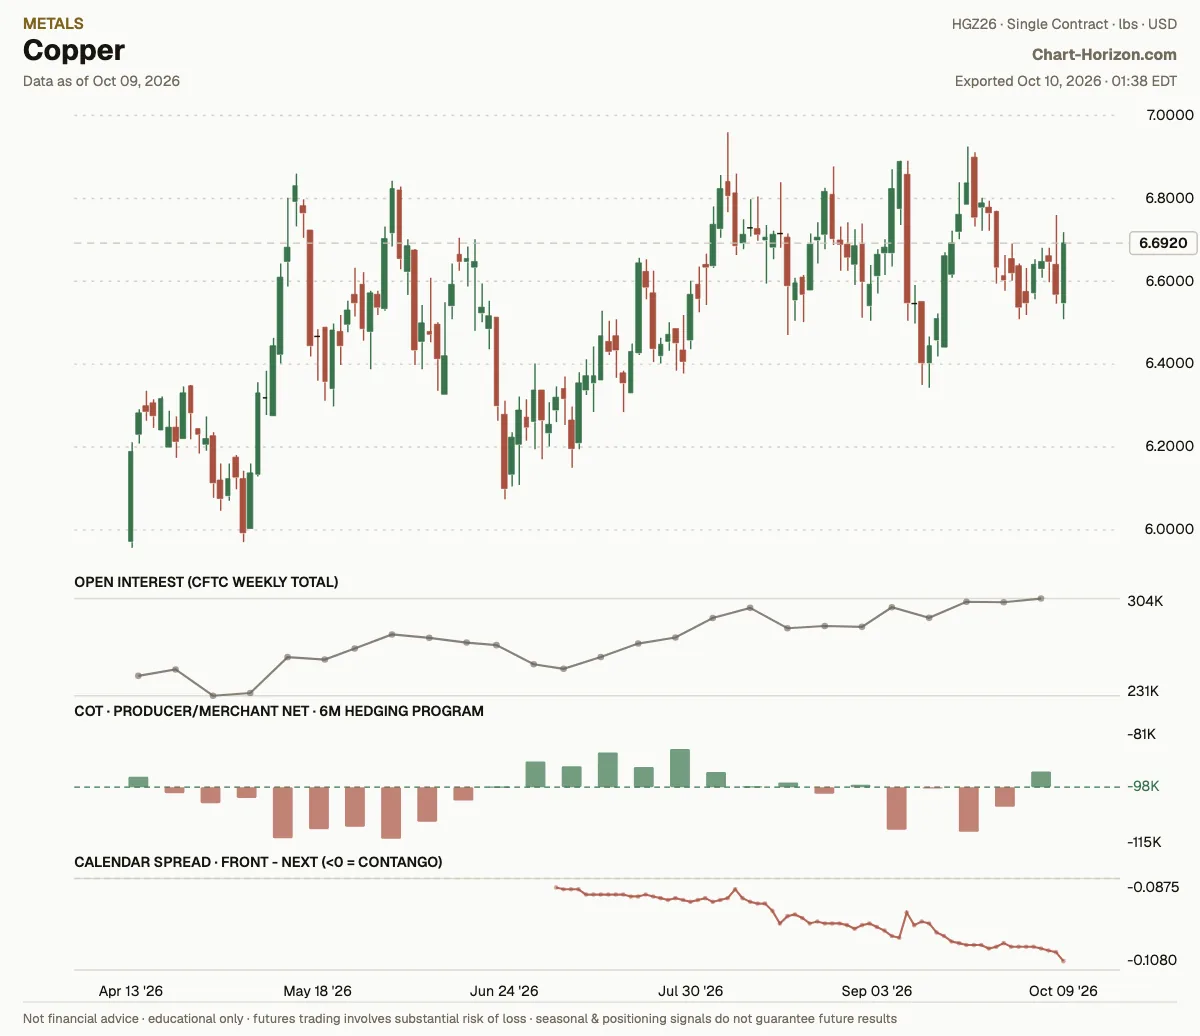
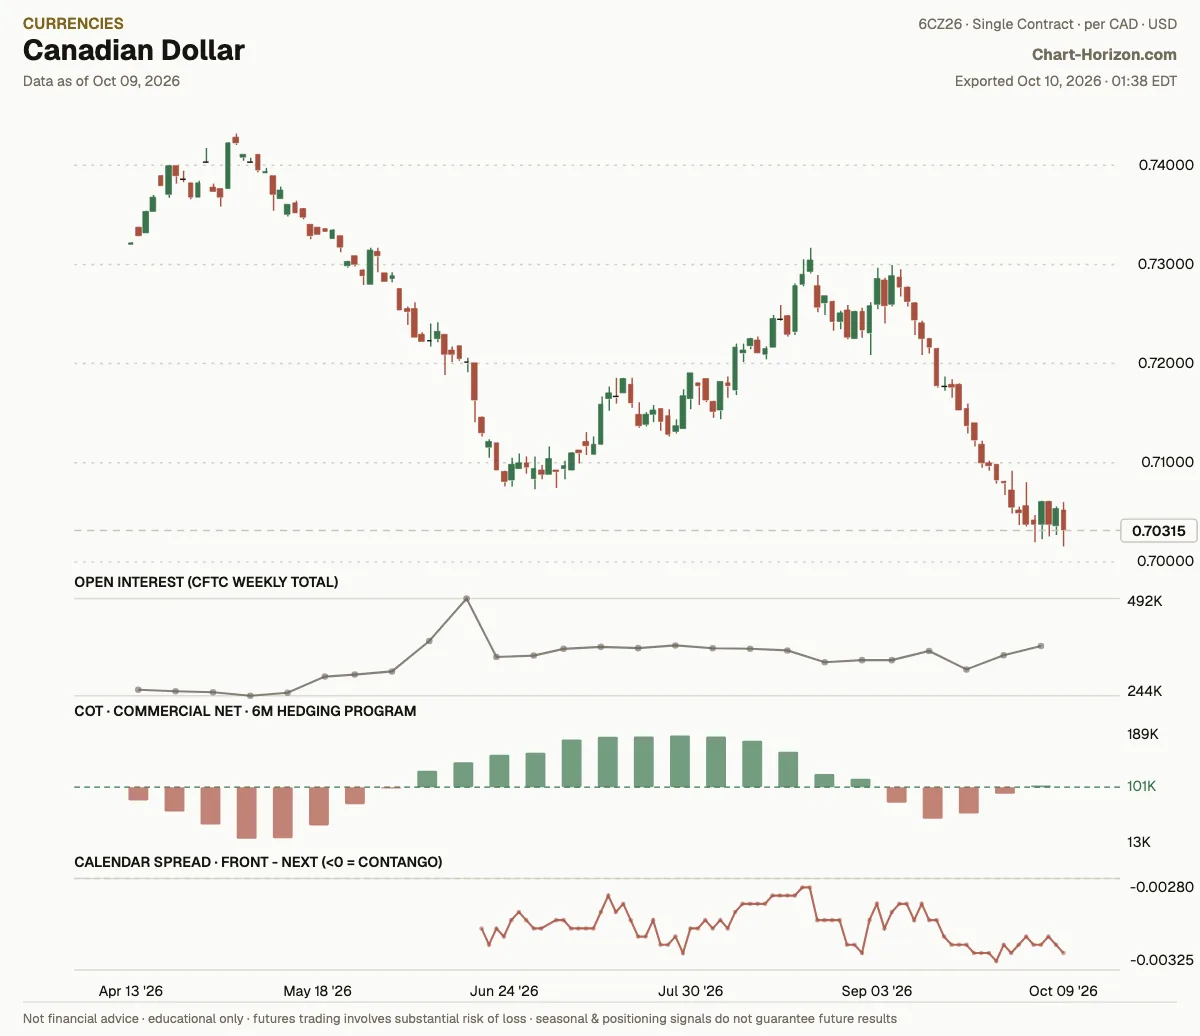
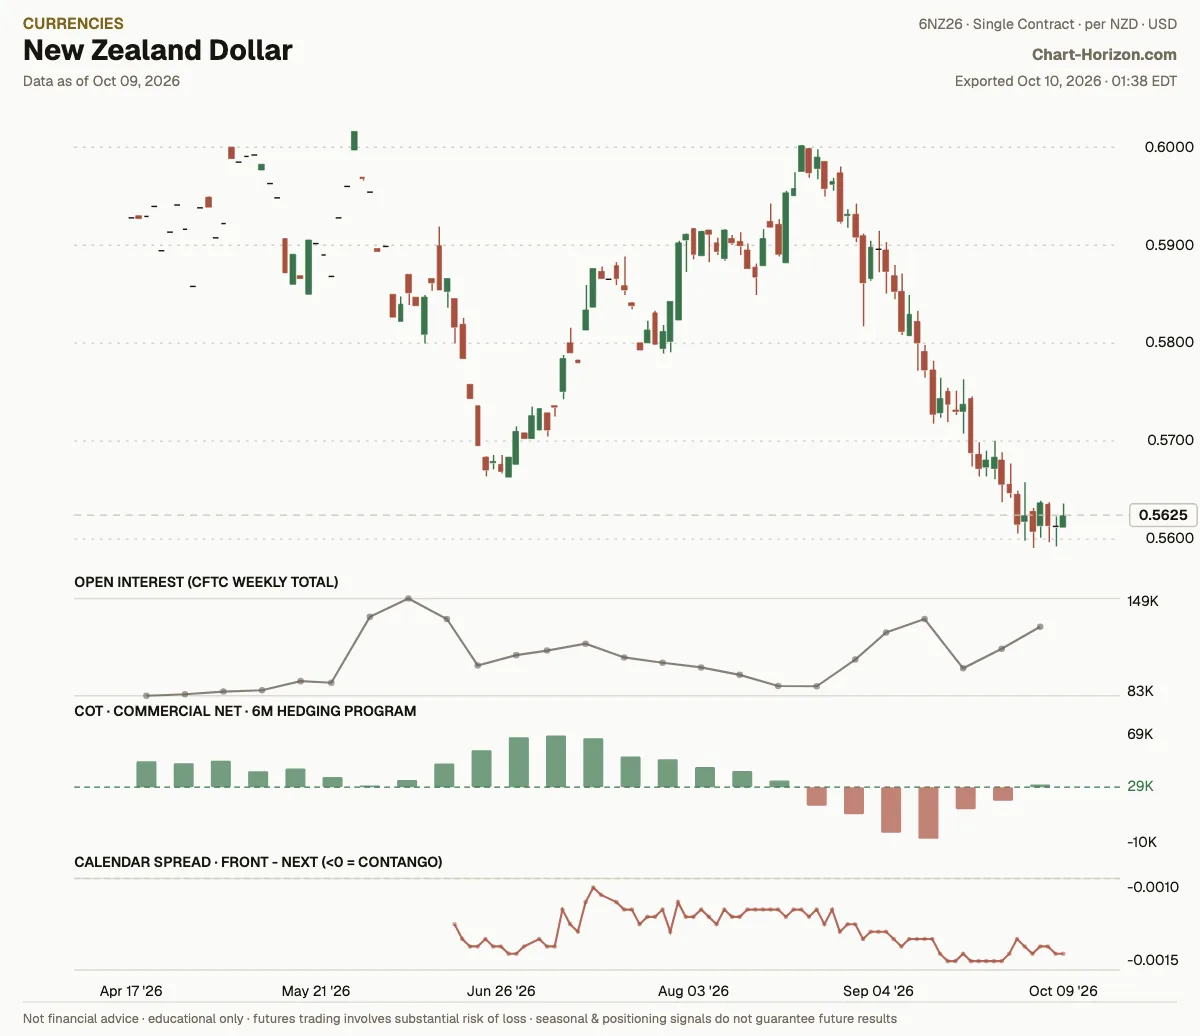
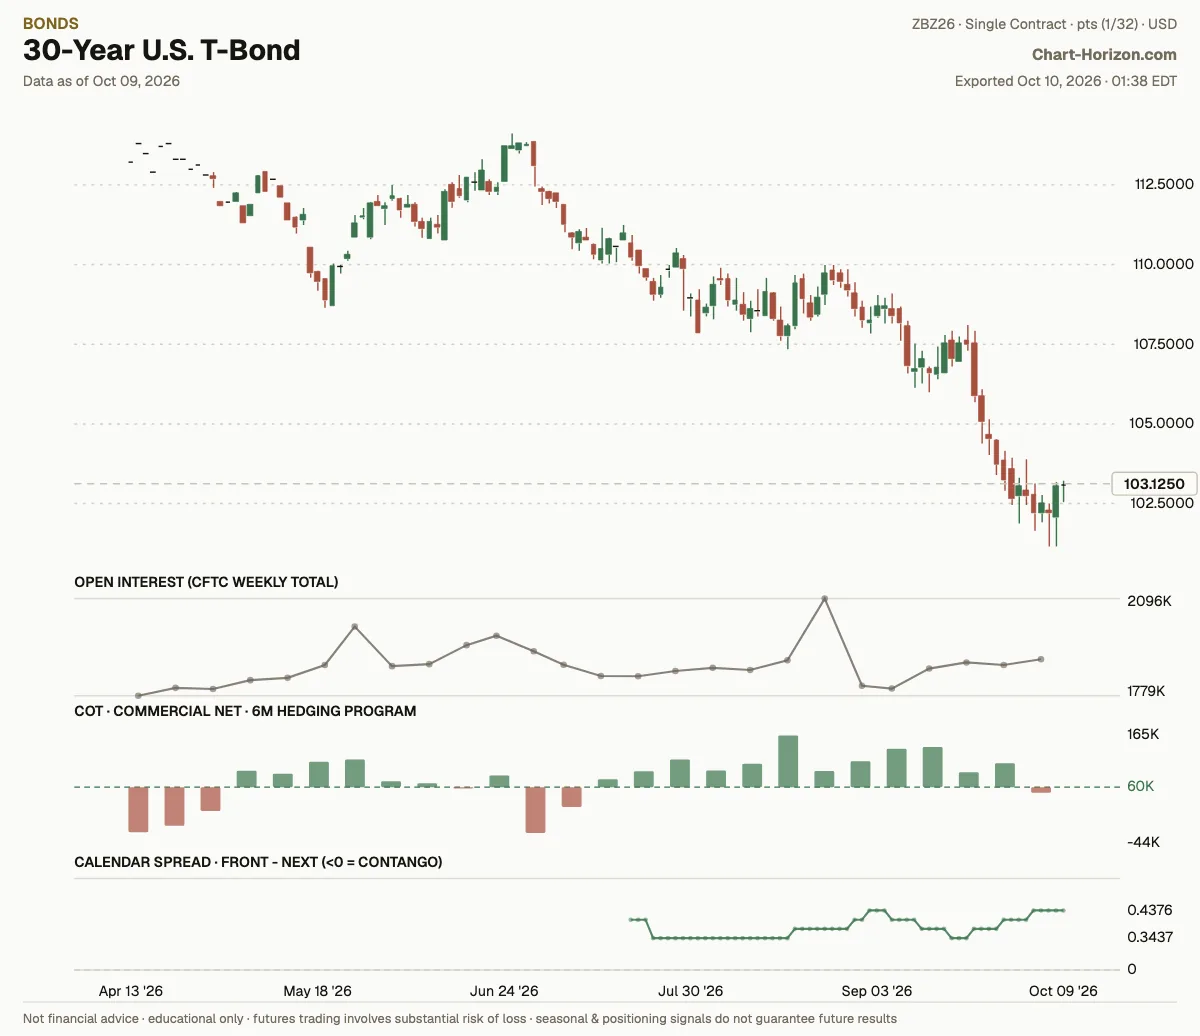
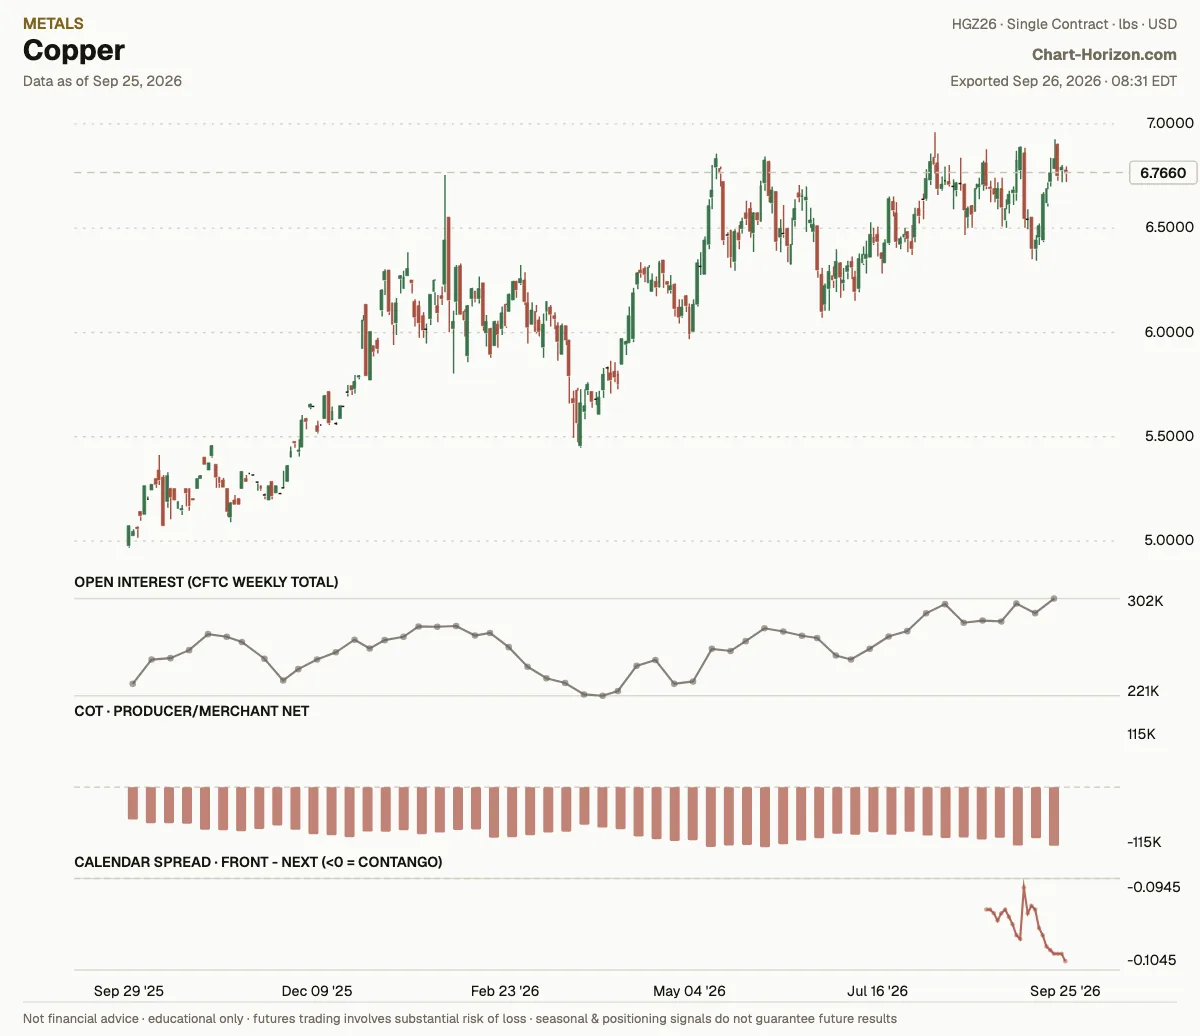
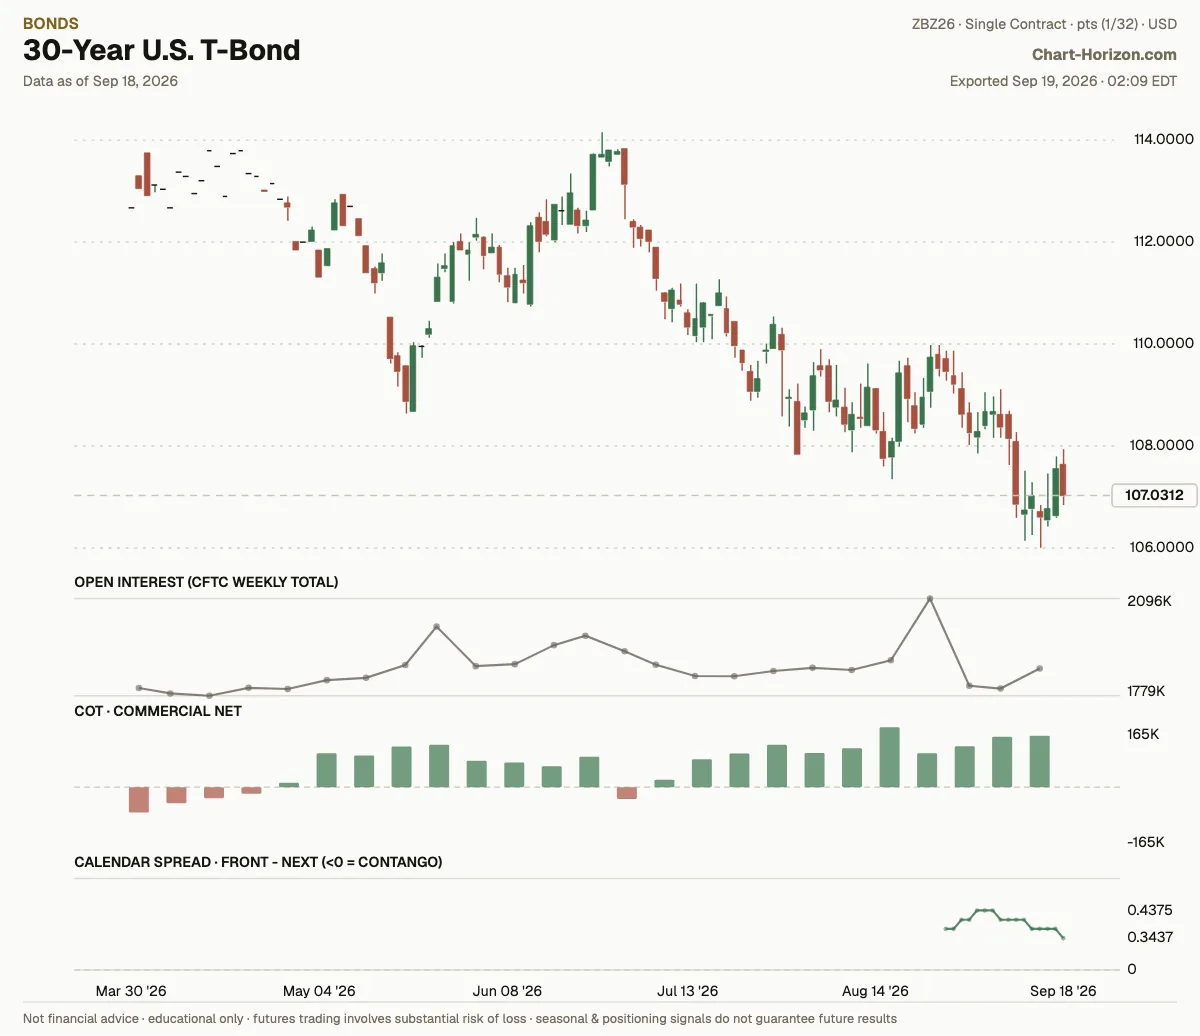
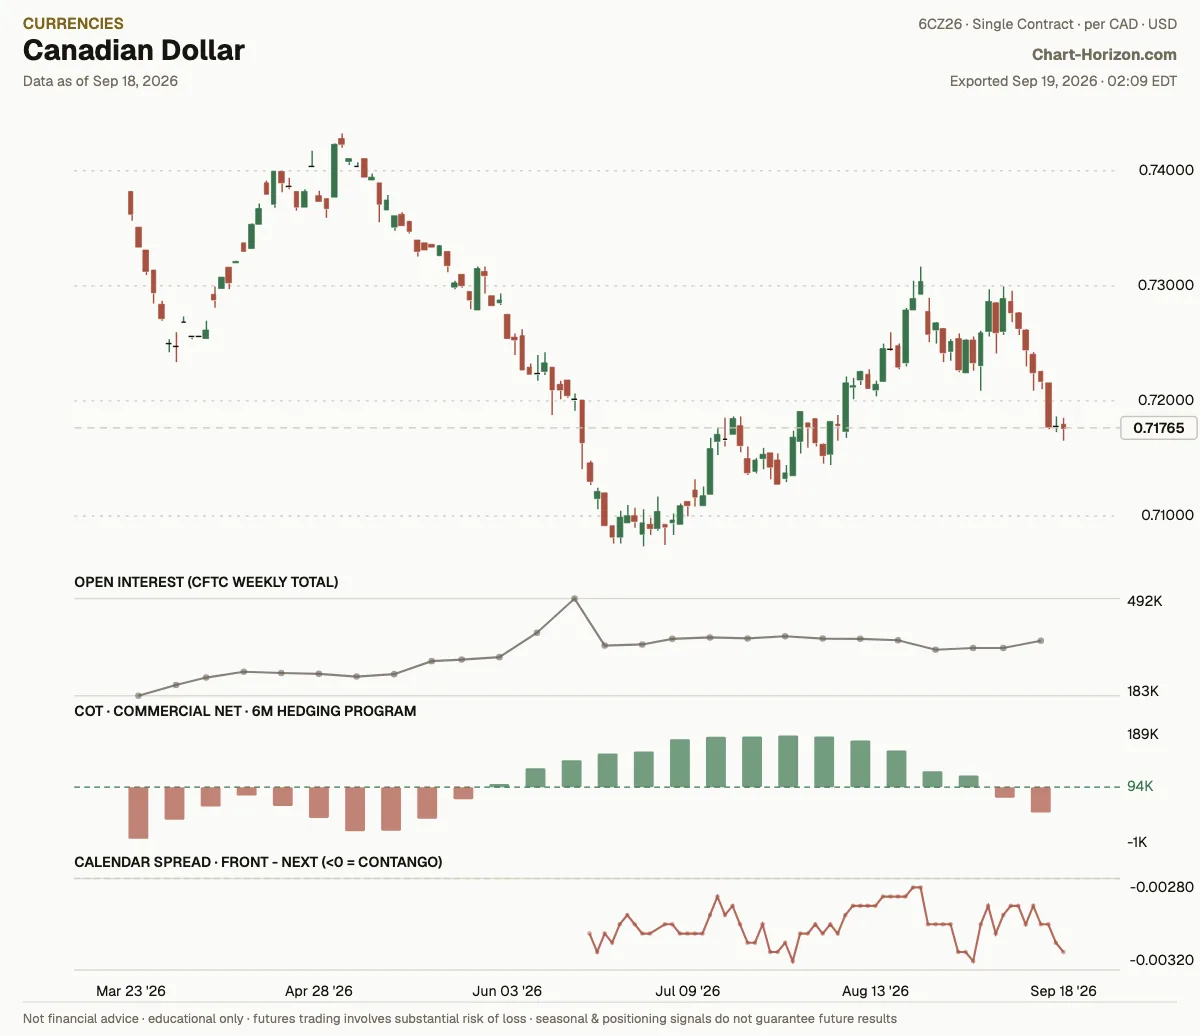
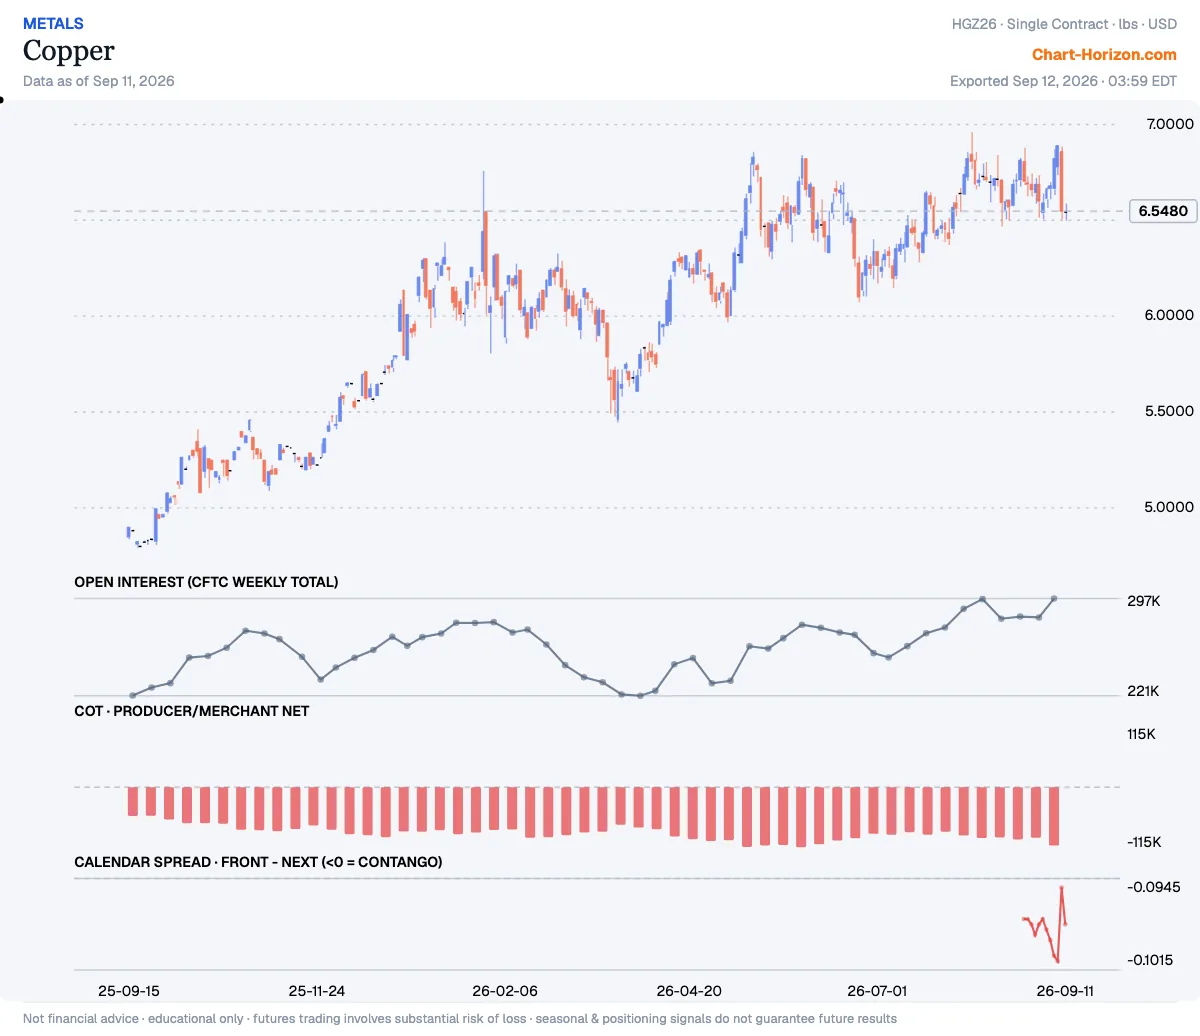
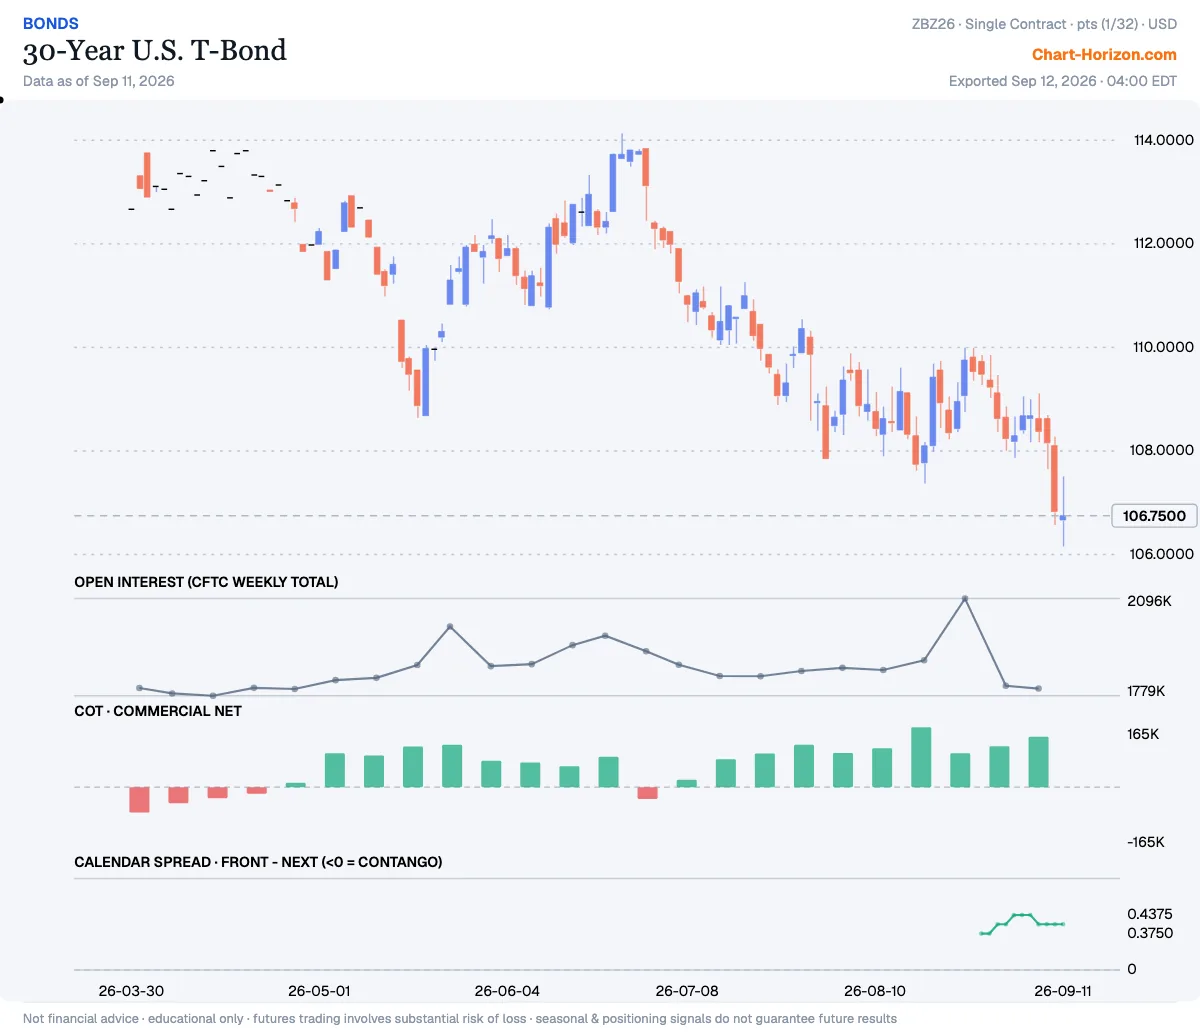
22 programs read above the midpoint of their own trailing six-month range this week, 17 below. Five crossed it with this report: Brent Crude Oil from above to below, Copper from below to above, Canadian Dollar from below to above, New Zealand Dollar from below to above and 30-Year U.S. T-Bond from above to below.
In the CFTC report of 2026-10-06, Producer/Merchant Net crossed the midpoint of its own trailing six-month range: it now sits below that midpoint, where the previous report still had it above. It cleared that midpoint by 35.3% of the window’s own range.
Copper: the program turns bullish
In the CFTC report of 2026-10-06, Producer/Merchant Net crossed the midpoint of its own trailing six-month range: it now sits above that midpoint, where the previous report still had it below. It cleared that midpoint by 15.0% of the window’s own range.
Canadian Dollar: the program turns bullish
In the CFTC report of 2026-10-06, Commercial Net crossed the midpoint of its own trailing six-month range: it now sits above that midpoint, where the previous report still had it below. It cleared that midpoint by 1.5% of the window’s own range: a crossing on the definition, and a coin-flip in fact.
New Zealand Dollar: the program turns bullish
In the CFTC report of 2026-10-06, Commercial Net crossed the midpoint of its own trailing six-month range: it now sits above that midpoint, where the previous report still had it below. It cleared that midpoint by 2.6% of the window’s own range.
30-Year U.S. T-Bond: the program turns bearish
In the CFTC report of 2026-10-06, Commercial Net crossed the midpoint of its own trailing six-month range: it now sits below that midpoint, where the previous report still had it above. It cleared that midpoint by 5.5% of the window’s own range.
]]>ChartHorizonLent, Not Spent2026-10-03T08:00:00+02:002026-10-03T08:00:00+02:00https://chart-horizon.com/2026/10/03/lent-not-spentTwo weeks ago, on the day the Federal Reserve raised its rate into $100 oil, this desk’s note
Priced to Pass read the futures curve as a market that expected
the shock to pass. It closed with four tests and a promise to report back.
Since that Wednesday the November WTI contract has fallen from $97.51 to $91.11. December
2027 has risen from $72.55 to $75.56. The gap between them has gone from $24.96 to $15.55 in
twelve sessions. The American barrel for this winter got cheaper and the barrel for next year
got dearer, at the same time.
The first half of that has a plain explanation, and it is mostly American. The second half has
more than one cause, and one of them is written into the terms on which the world’s emergency oil
is being handed out.
What eased, and what did not
Saudi Arabia was reported restarting its East-West pipeline on 22 September, and on Friday it
was said to be carrying more than 80 per cent of its capacity, ahead of the six weeks Aramco had
given for a full return. More oil also went the short way. Saudi shipments through the Strait of Hormuz
averaged 2.9 million barrels a day in September, against about one million in August, and total
flows through the strait were the highest since the war began.
Then the stockpiles. On 29 September the Energy Department offered up to 40 million barrels from
the Strategic Petroleum Reserve, the last tranche of the 172 million ordered in March. On Friday
the G7, in a statement presented by President Macron, said its members would release up to 100
million barrels of crude and diesel over four months, with a “frontloaded substantial release” of
diesel within twenty days. Washington had pressed Europe to act, with a ban on American diesel
exports as the alternative. November WTI settled 1.9 per cent lower that afternoon. December
Brent finished almost exactly where it started.
What did not ease was the war. Iran’s president said on 23 September that the country would not
surrender, and Brent rose 4 per cent that day. On Thursday, with word that a third American
carrier strike group and an amphibious group carrying more than 2,000 Marines were heading for
the region, it rose 4 per cent again.
The curve, two weeks on
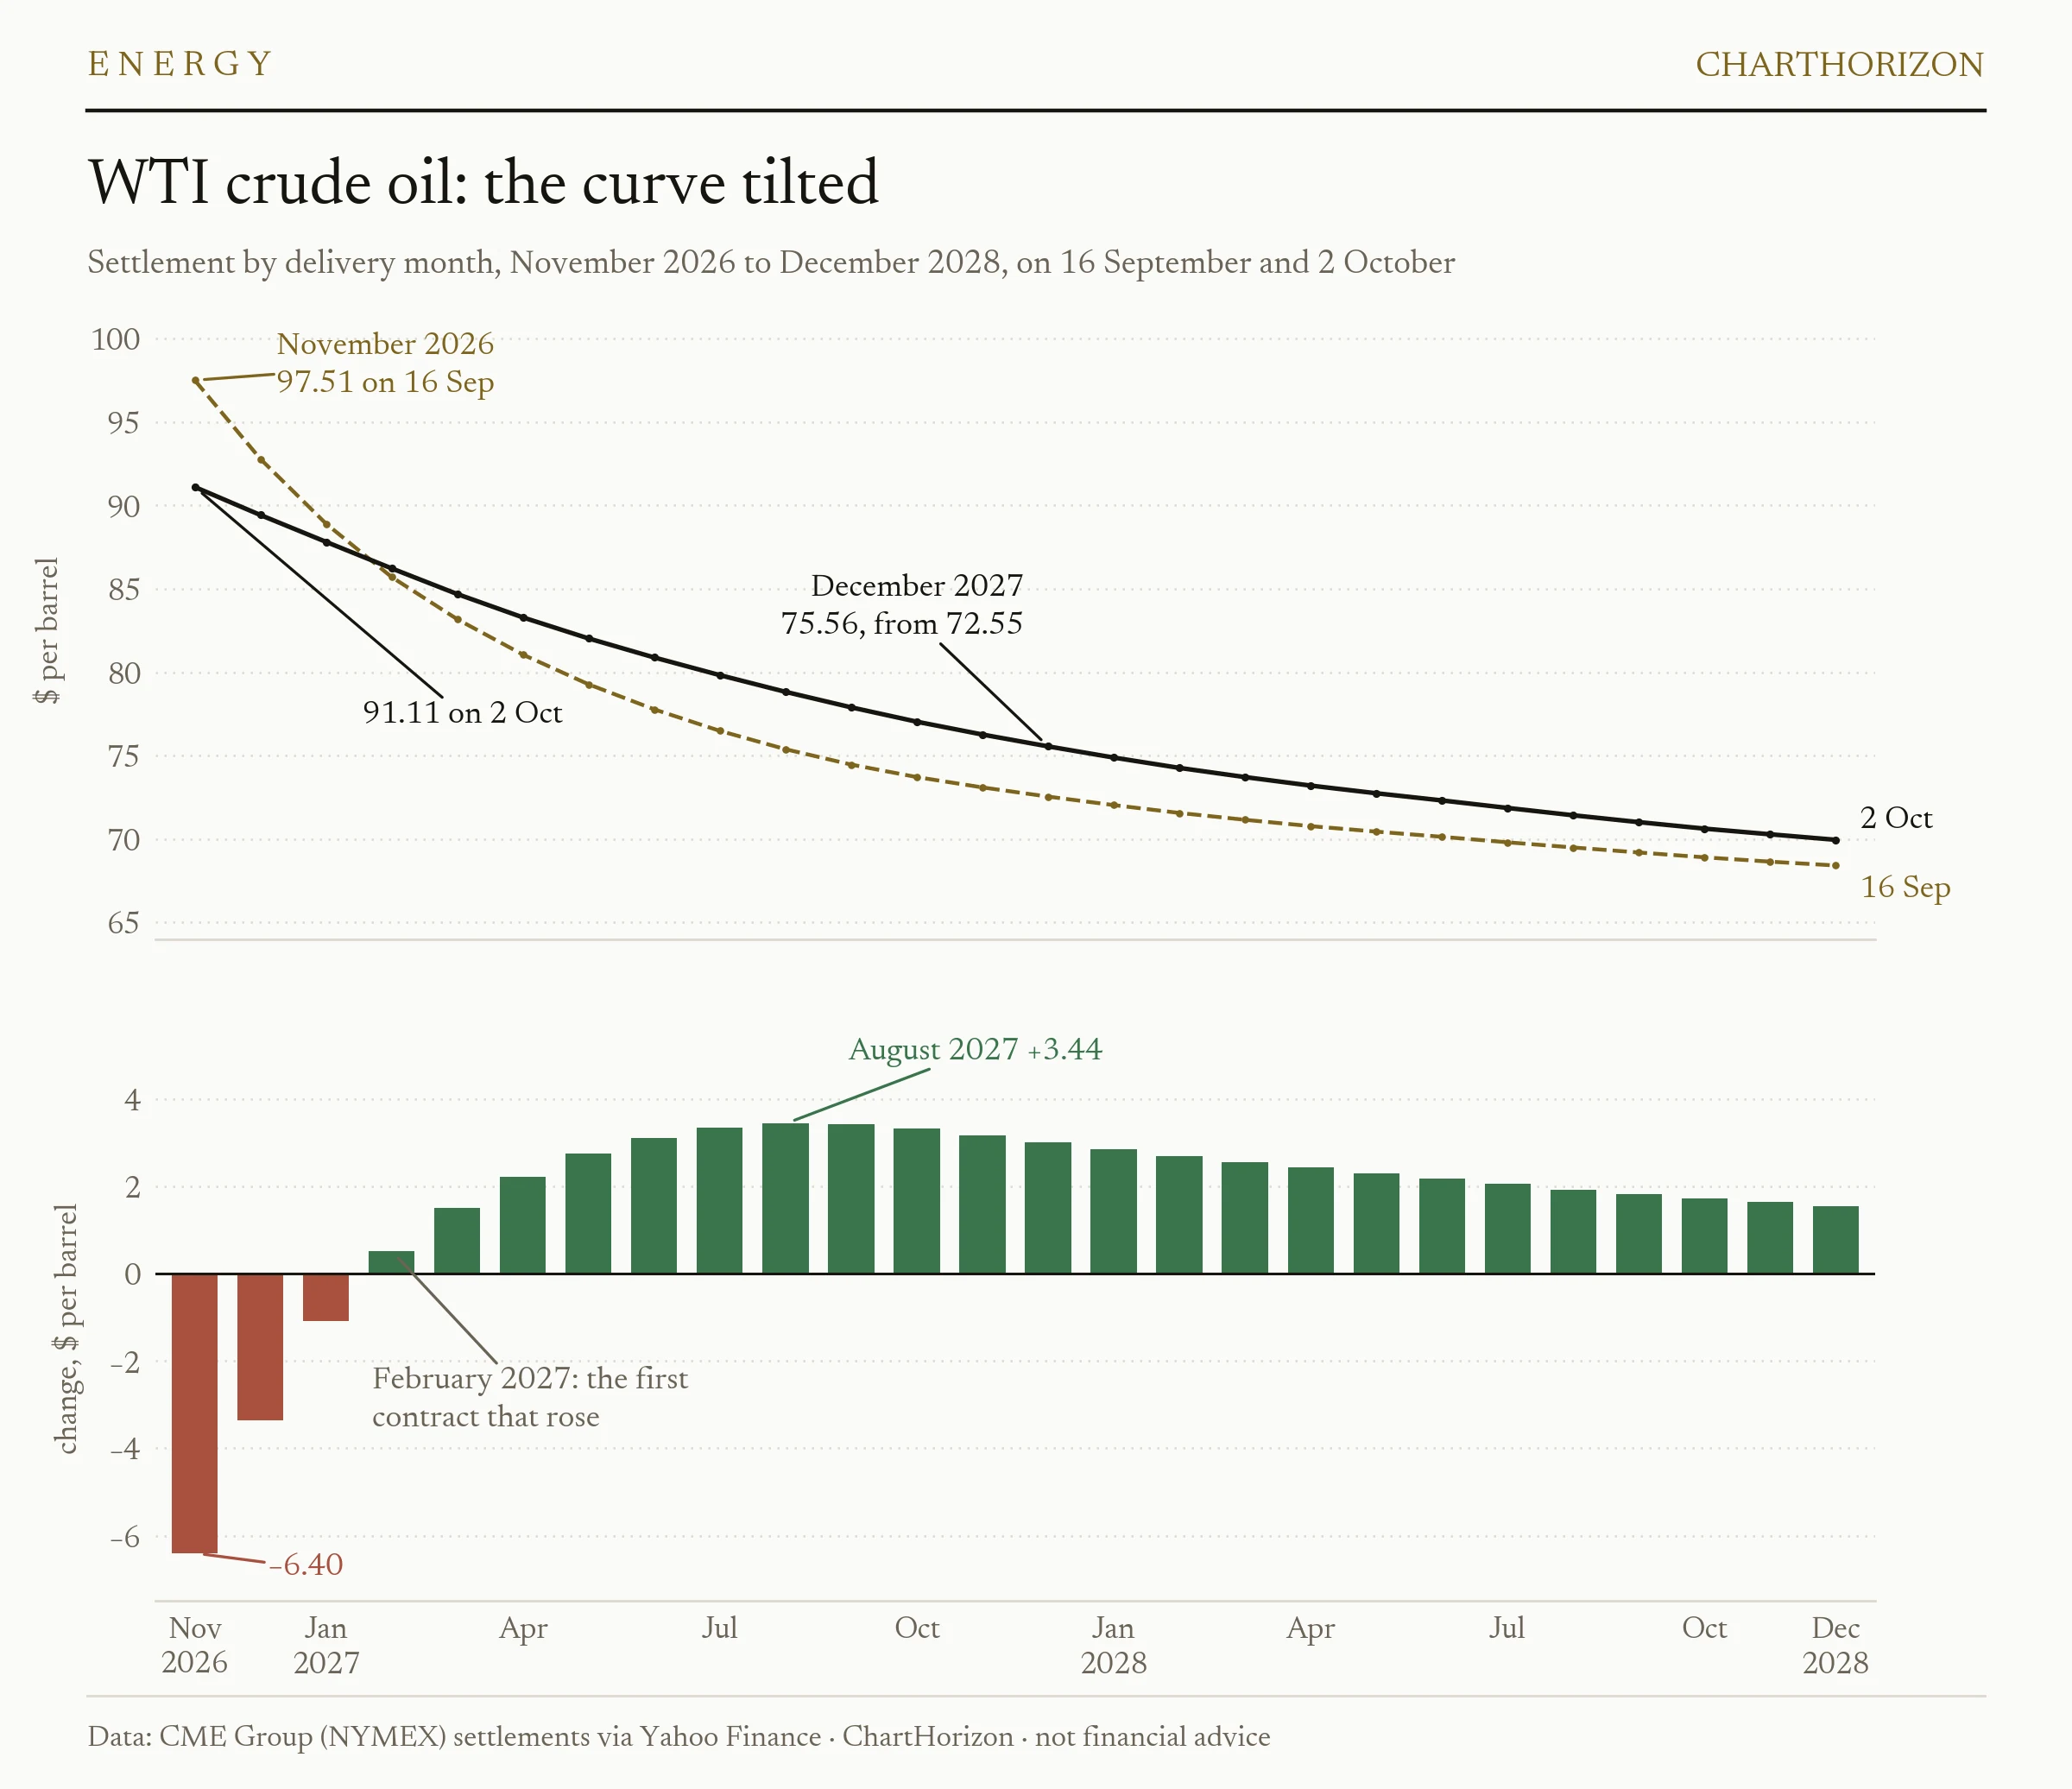
WTI crude oil futures · settlement by delivery month, November 2026 to December 2028 · 16 September and 2 October · CME Group via Yahoo Finance · ChartHorizon
Every contract from November 2026 to January 2027 settled lower on Friday than on 16 September.
Every contract from February 2027 to December 2028, the last on the chart, settled higher. The
largest gain, $3.44, was in August 2027. The twelve months of 2027 averaged $80.87 on Friday,
against $78.47 on the day of the hike, and 2028 rose from $70.05 to $72.20.
If the front had simply come back down after a rally, the back of the curve would have stayed
where it was. It did not stay, and not only in America: December 2027 Brent rose from $78.39 to
$81.93. The shock got smaller in America, and it got longer everywhere.
Part of that is the war. A third carrier group is not the sign of a conflict about to end, and a
risk premium that was priced for weeks moves down the curve when weeks start to look like
seasons. The other part is less visible.
A loan, not a sale
The American reserve is not being sold. The 172 million barrels ordered in March are being lent
through exchanges: a refiner or trader takes crude now and returns it later, with extra barrels as
interest. The Energy Department says its exchanges have won a premium of 25 per cent. Under the
terms published in the spring, the barrels come back between November 2026 and September 2028.
“These exchanges will also ensure America’s Strategic Petroleum Reserve continues to be
refilled,” Energy Secretary Chris Wright said of the latest offer.
The reserve held 283.8 million barrels in the week to 25 September, according to the Energy
Information Administration. That is the least since October 1982, and 131.7 million fewer than
in March.
So the barrels that have pushed this autumn’s price down are owed back, with about a quarter
added, over the next two years. Whoever borrowed them is short those future barrels until they
buy them, and the way to cover that in advance is to buy deferred futures. In that sense the
barrels lent this winter are already demand in 2027. The commitments report cannot show who
bought December 2027 these past two weeks, because it does not split positions by delivery month.
But the chart has the shape this arrangement produces: lower prices while the barrels flow out,
higher prices in the months they are due back. It is not the only cause, but it is the one with
a schedule. The G7’s barrels come from stocks that members are obliged to hold, and those will
have to be rebuilt too.
The arrangement also limits itself. Leaving aside the cost of money, a company that takes a
barrel now and hands back 1.25 barrels a year later comes out ahead only if today’s barrel is
worth at least a quarter more than next year’s. On 16 September December 2026 crude cost 27.9
per cent more than December 2027. On Friday it cost 18.4 per cent more. At a 25 per cent premium,
borrowing for a year on those two contracts no longer pays. Bids for the last 40 million barrels
close on Tuesday.
The American barrel
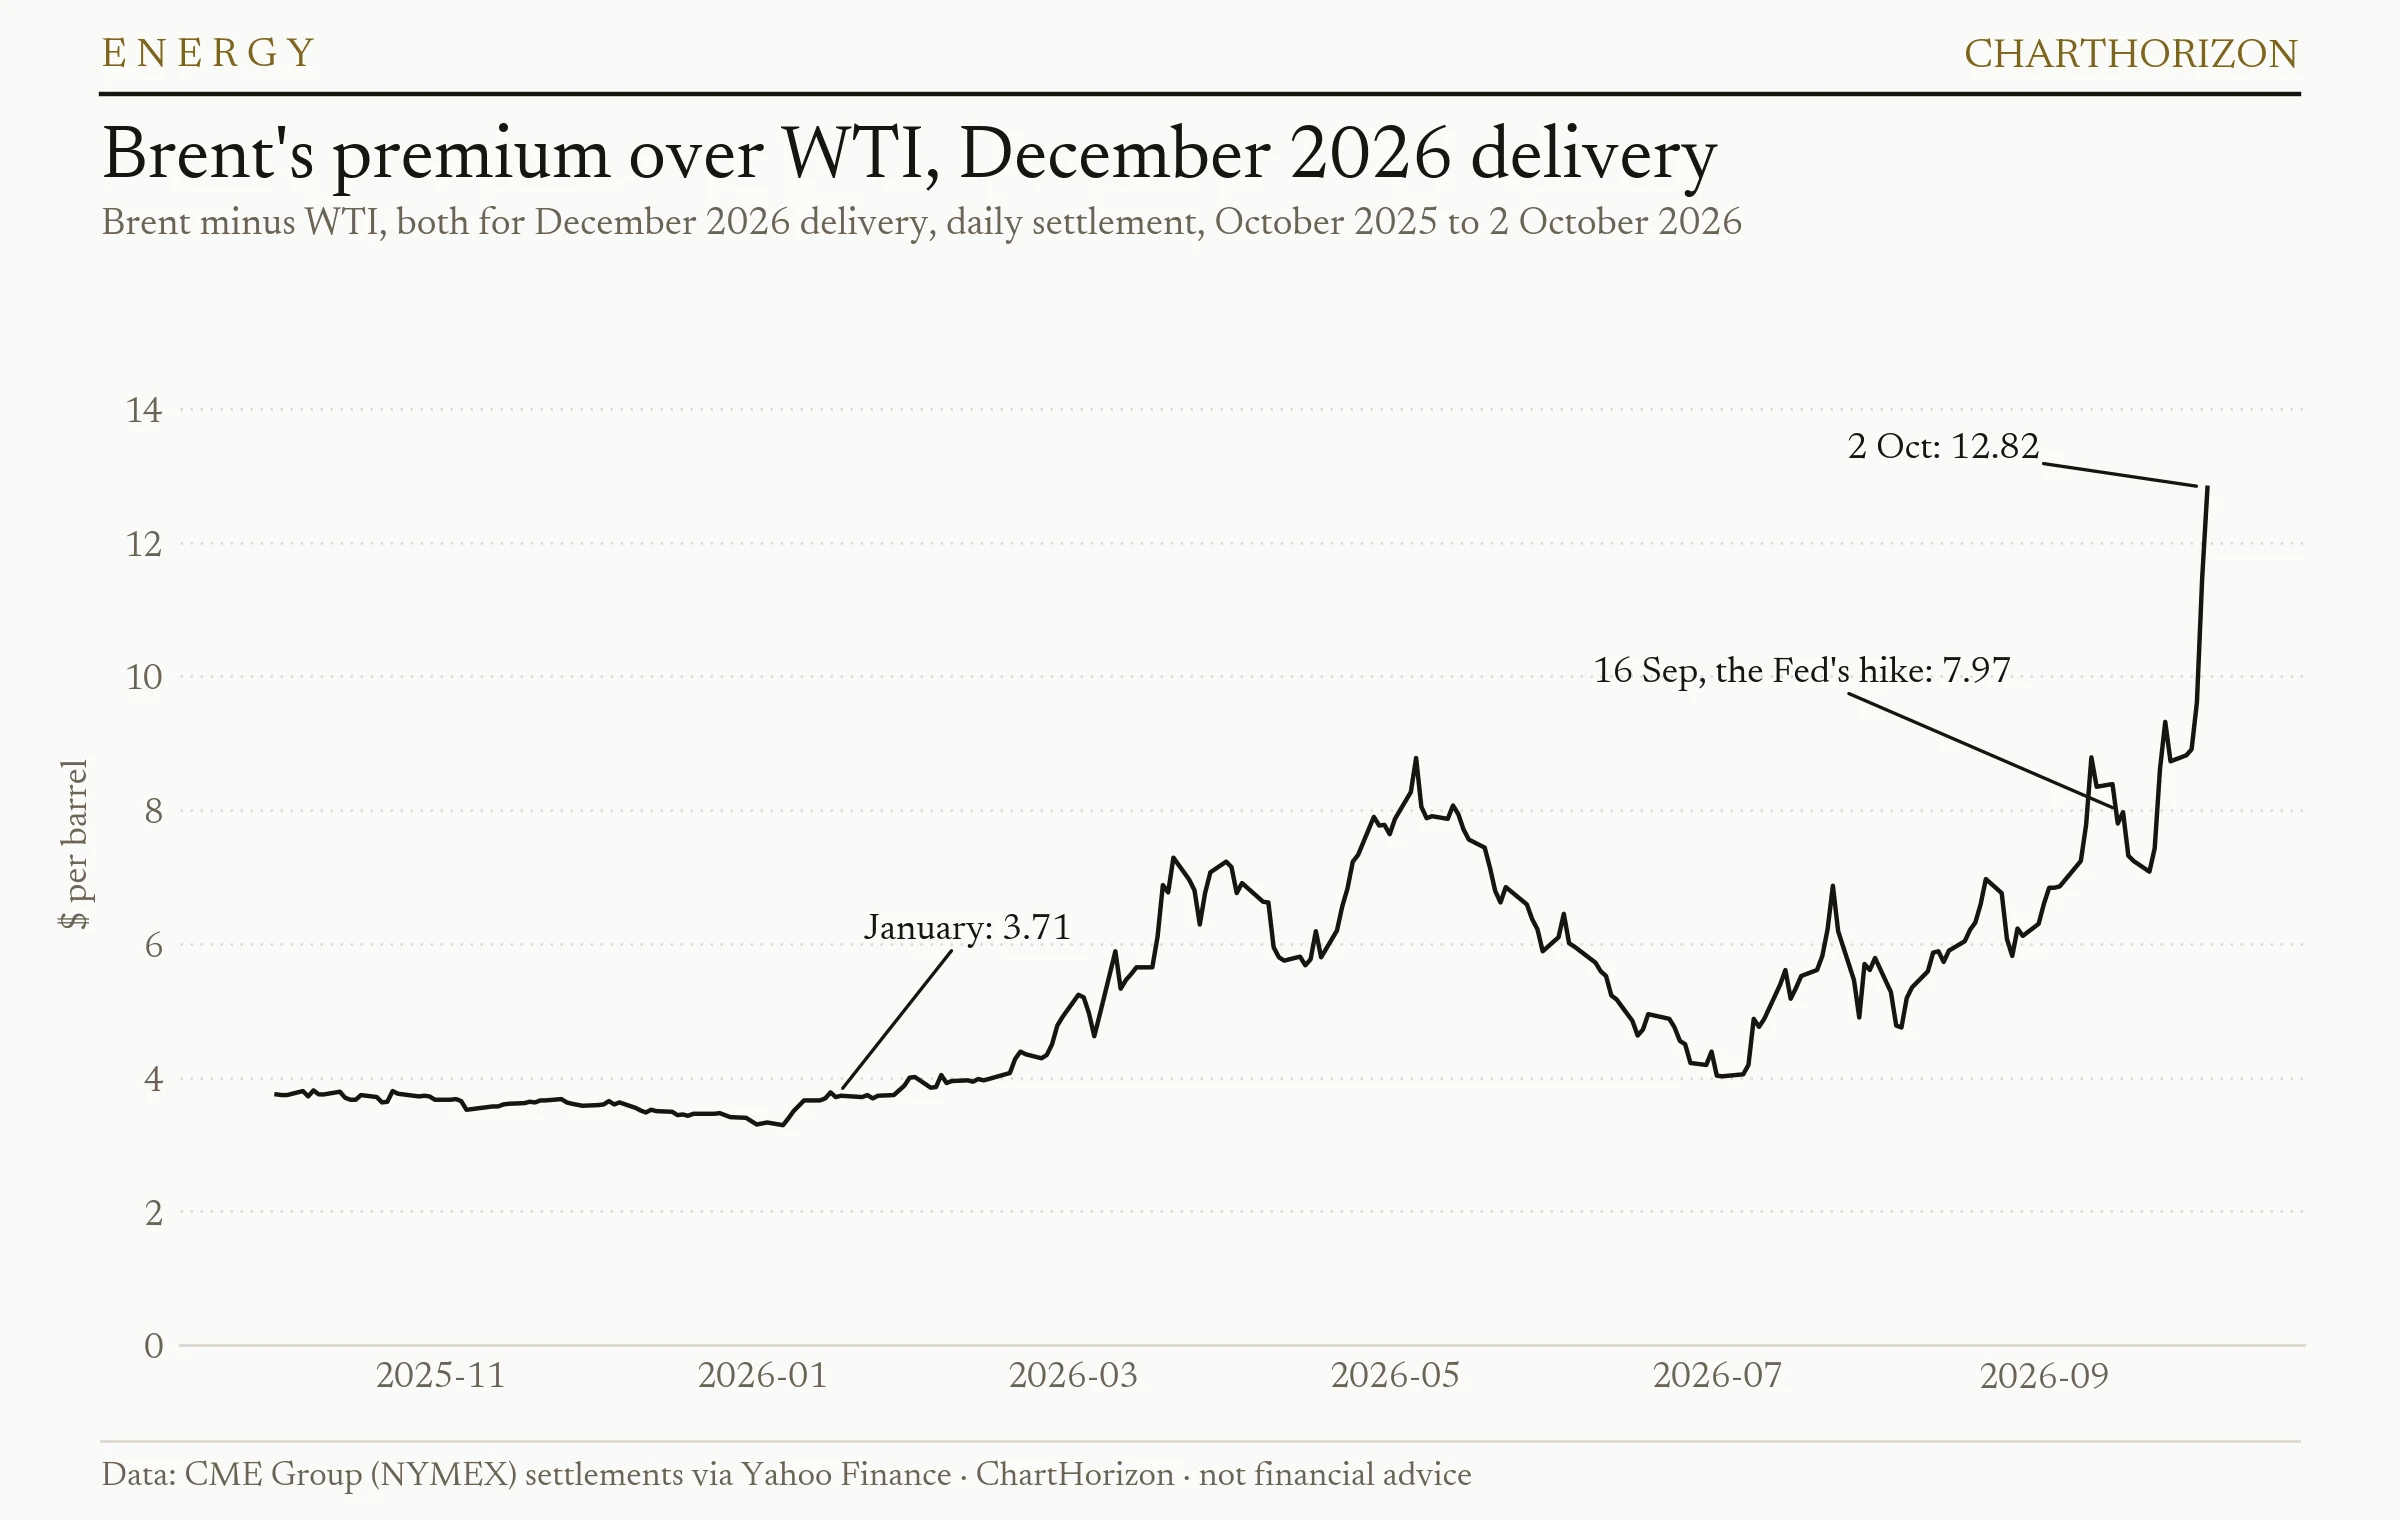
Brent minus WTI crude oil futures, both for December 2026 delivery · daily settlement, October 2025 to 2 October 2026 · CME Group via Yahoo Finance · ChartHorizon
The fall at the front is an American fall. Since the hike December WTI has lost $3.36, while
December Brent, the seaborne barrel that Europe and Asia pay for, has gained $1.49 and stood at
$102.25 on Friday.
Until Tuesday the two moved together, and the gap between them ended that day within a dollar of
where it had started. Then they parted.
On Thursday the carrier news added $4.28 to December Brent and $2.42 to WTI. On Friday the G7’s
statement took $1.41 off WTI and six cents off Brent. December Brent had stood $3.71 above
December WTI in January and $7.97 on the day of the hike. It finished the week $12.82 above,
the widest gap in the twelve months of prices the desk has for the pair, and $3.91 of that came in
the last three sessions.
The reserve’s barrels are American ones. The last tranche comes out of Big Hill and Bryan Mound
on the Texas coast, and the shortage it answers is in the seaborne market. So the $91 on American
screens is partly a local price. The war premium sits on the other benchmark.
What the four tests say
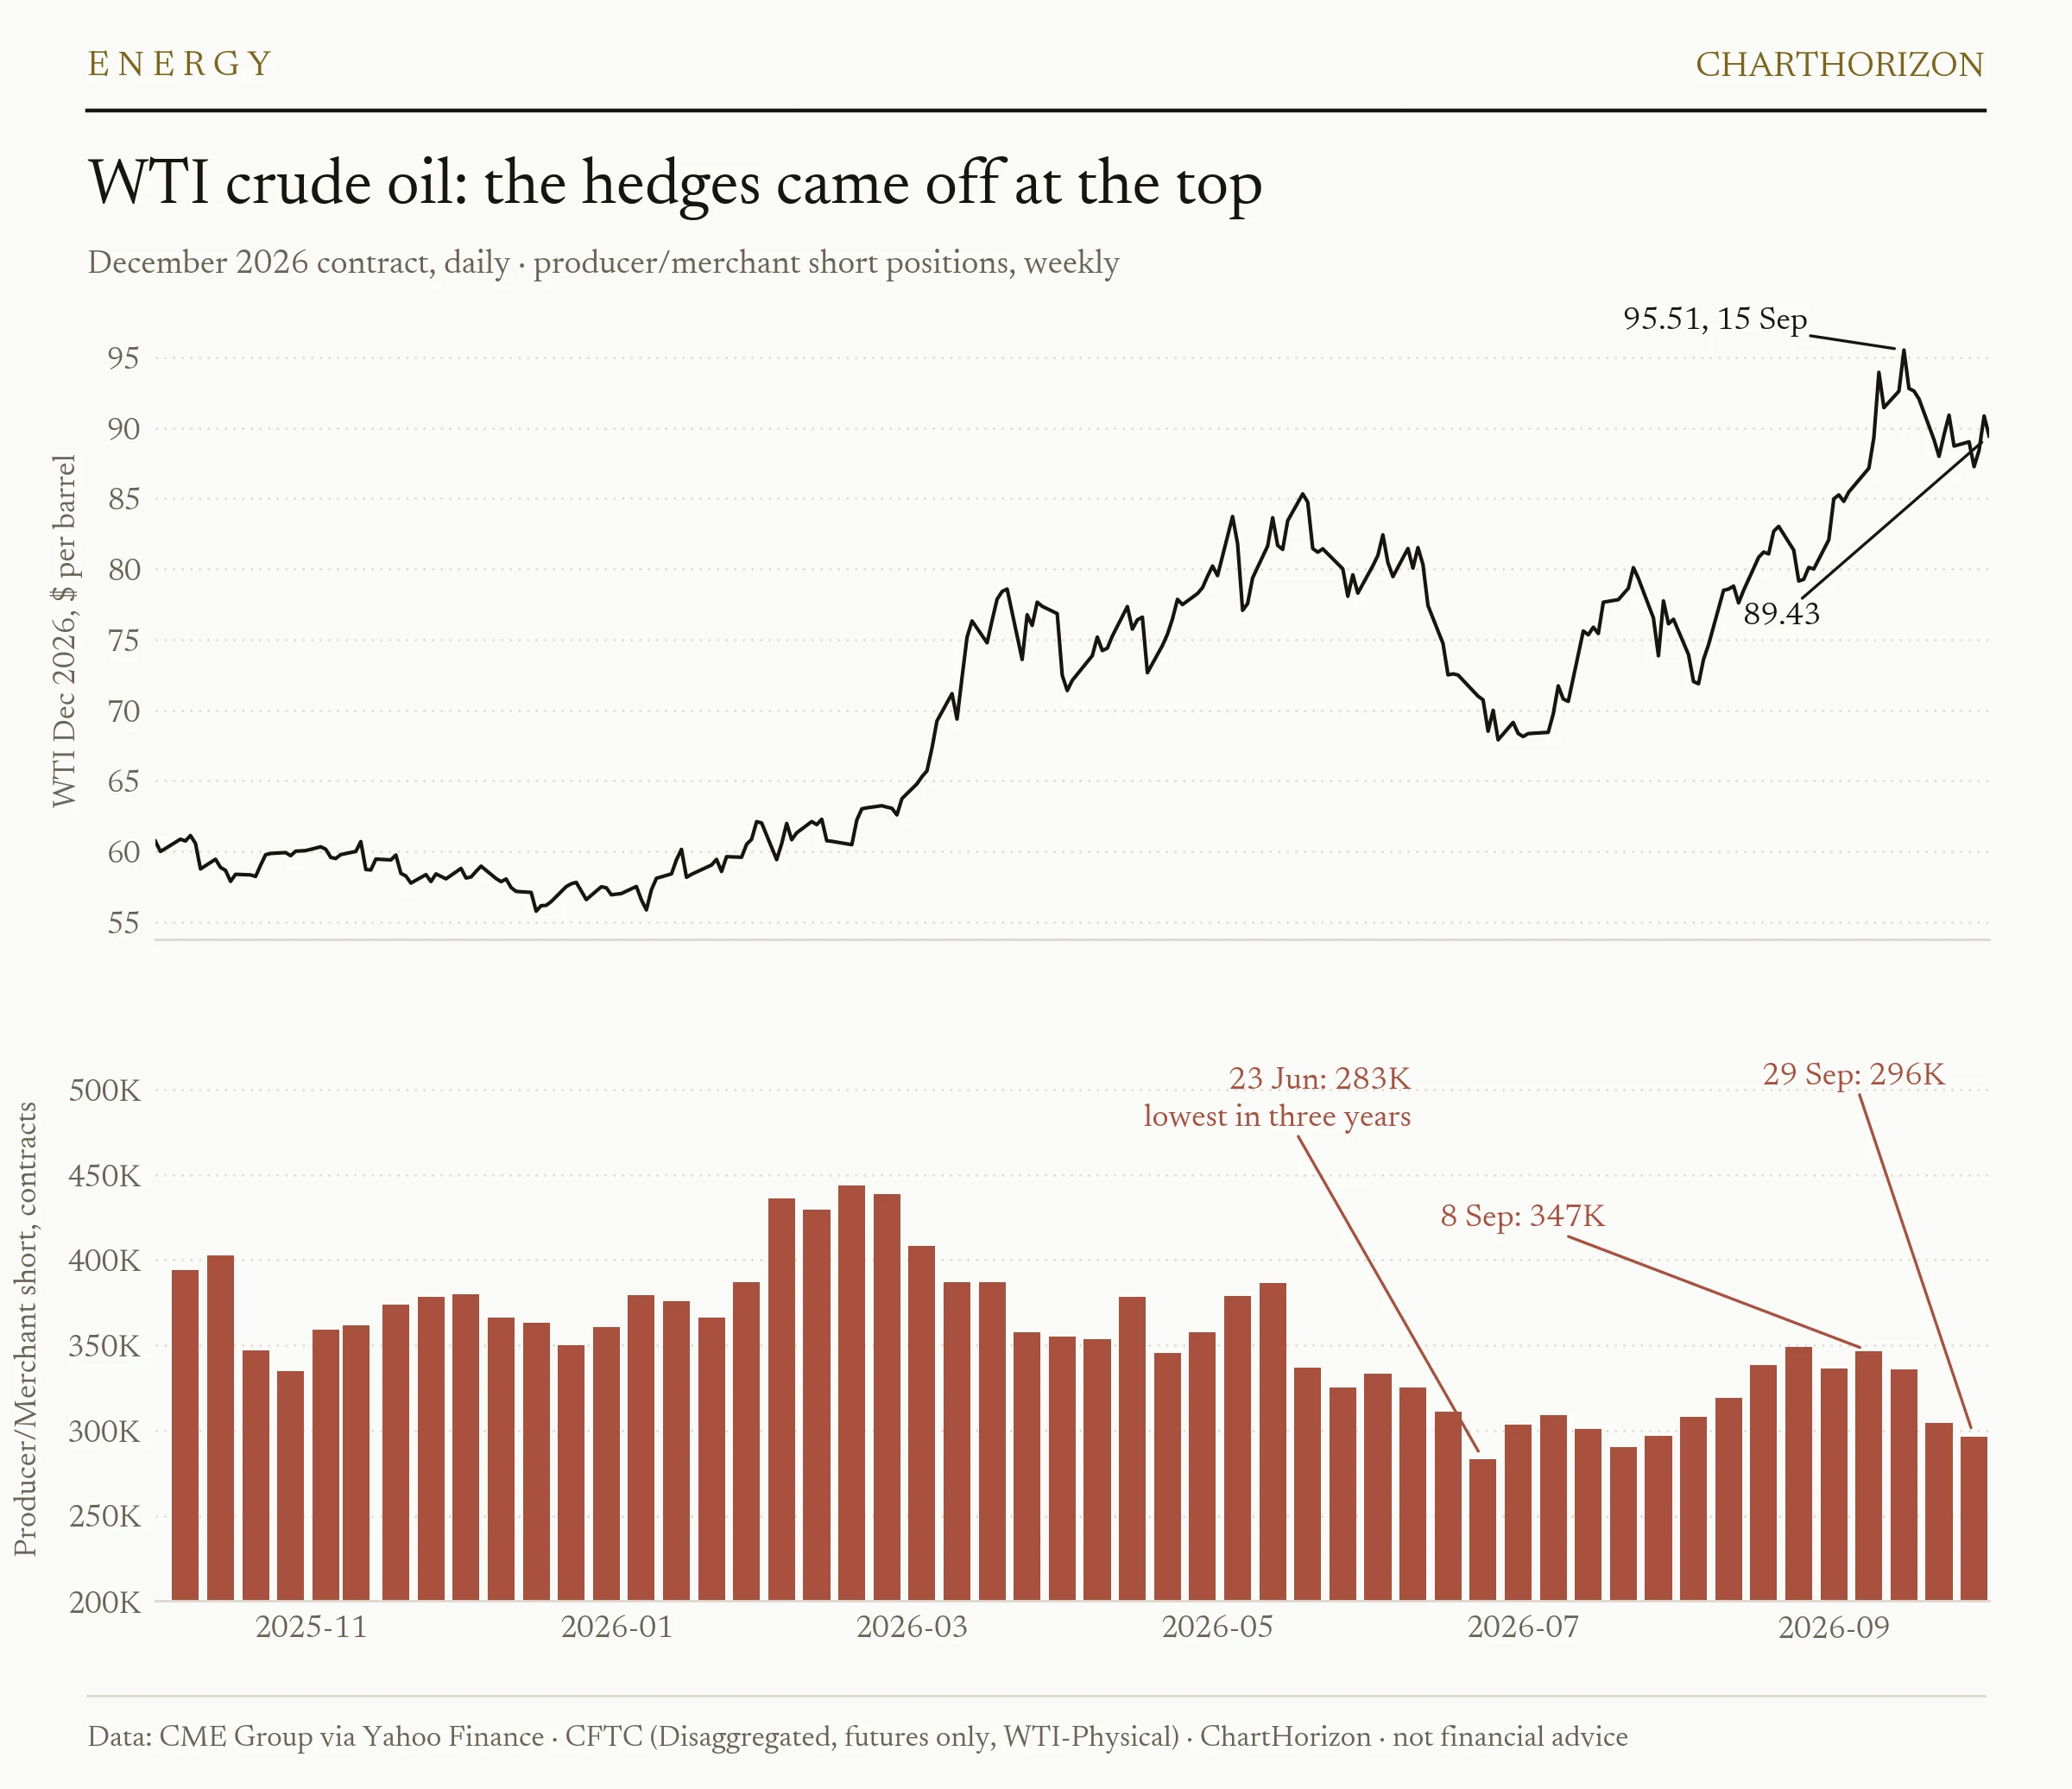
WTI crude oil · December 2026 contract, daily · producer/merchant short positions, weekly, one year · CFTC Disaggregated report, futures only · ChartHorizon
The back of the curve stays put. Not met, but it moved the way the test was watching for.
December 2027 rose $3.01 to $75.56, still $4.44 short of $80, and the front did not hold: it
fell. The 2027 average did cross $80. That was not the test, and it is noted only because it is
roughly the price at which a producer could sell next year’s output today.
The long-run inflation rate stays below its high. Holding, just. The five-year, five-year
forward fell to 2.31 per cent on the day of the hike, was back at 2.35 two sessions later, and
has stayed between 2.33 and 2.36 since. It closed at 2.36, a new high for the year, on four
days. One basis point is not “clearly above”, so the test is not called, but the hike has not
brought it down either. The ten-year Treasury yield rose 23 basis points through Thursday, 20
of them in the inflation-protected real yield and 3 in breakeven inflation. The bond market
charged more for money, not for inflation.
The spread narrows when the pipeline returns. Met. The December-January spread was $3.88
on 16 September, $2.28 on the day the pipeline restarted, $1.54 on 29 September and $1.61 on
Friday, against the $1.50 it showed in August. To that extent the shortage it measured was the
pipeline’s. Brent’s equivalent spread narrowed too, from $4.07 to $2.65 by Tuesday, but was
back at $3.54 on Friday after the carrier news.
The hedgers sell at $100. They did the opposite. The producer/merchant short book fell
from 346,775 contracts on 8 September to 335,812 in the report dated 15 September, the first
after the $100 break, then to 304,558 and 296,348. That is the fifth-smallest of the 157
weekly reports since October 2023. Part of the second drop is the October contract’s expiry,
which closes positions on both sides, and the long side fell by about as much that week. The
other two weeks are not explained by it. By the test’s own terms, the producers did not say
they expected $100 to last.
Taken together, the read of two weeks ago holds at the front and has slipped at the back. The
shock is passing, more slowly than the curve priced on 16 September.
What would change this read
The last tranche finds borrowers. Bids for the final 40 million barrels close on Tuesday,
6 October. A full award at this flatter curve says the exchanges still pay. A short one says
the curve has flattened to the point where borrowing no longer does, which also removes one
source of buying at the back.
December 2027 goes through $80. The same line as two weeks ago, because it is still the
right one. The contract is at $75.56 and has risen in nine of the twelve sessions since the
hike.
The Brent-WTI gap closes when the American deliveries end. The last tranche goes out in
November and December. If December Brent still stands near $12 over WTI once it has, the gap
is about export capacity and the shortage abroad, not about the reserve.
The five-year, five-year forward closes above 2.40 per cent. The Fed’s next decision is on
28 October. A close at that level before then would mean the hike has not bought what it was
meant to, whatever oil does in the meantime.
The read
Two weeks ago the curve said the shock would pass, and the Fed bought insurance that it would.
The front of the American curve has since done what that read expected, for reasons that are
easy to name: a pipeline back in service, more ships through the strait, and a reserve opening
on the Texas coast. The seaborne barrel has not followed.
The back did not wait, on either side of the Atlantic. Some of that is a war that looks longer
than it did. Some of it is arithmetic: the barrels pulling this winter’s price down are owed
back, with interest, in the months that rose, and the hedgers did not lock in $100. Emergency stocks can move a
shortage in time. They cannot make it disappear, and on a futures curve the bill shows up on the
right-hand side.
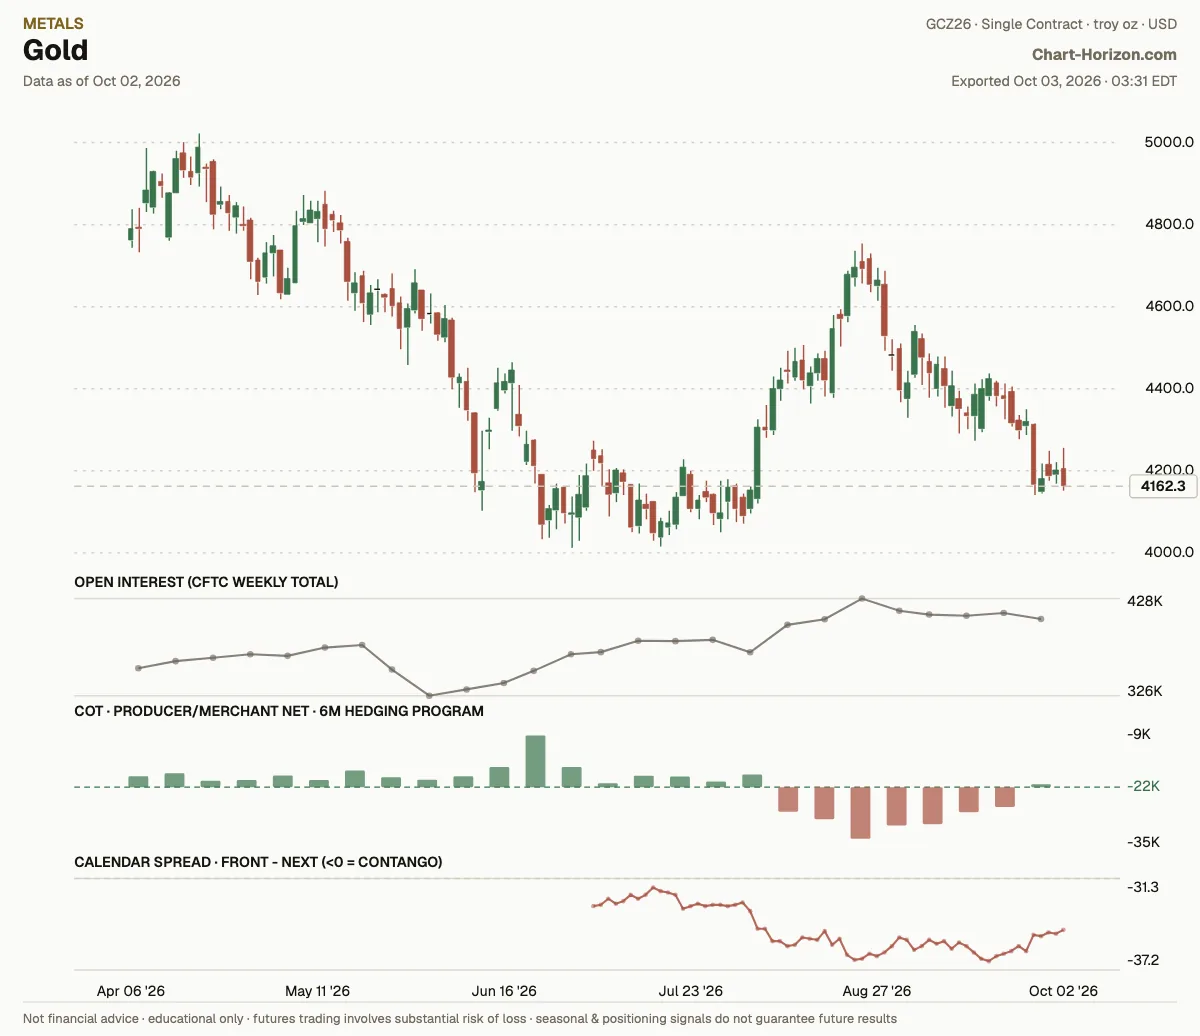
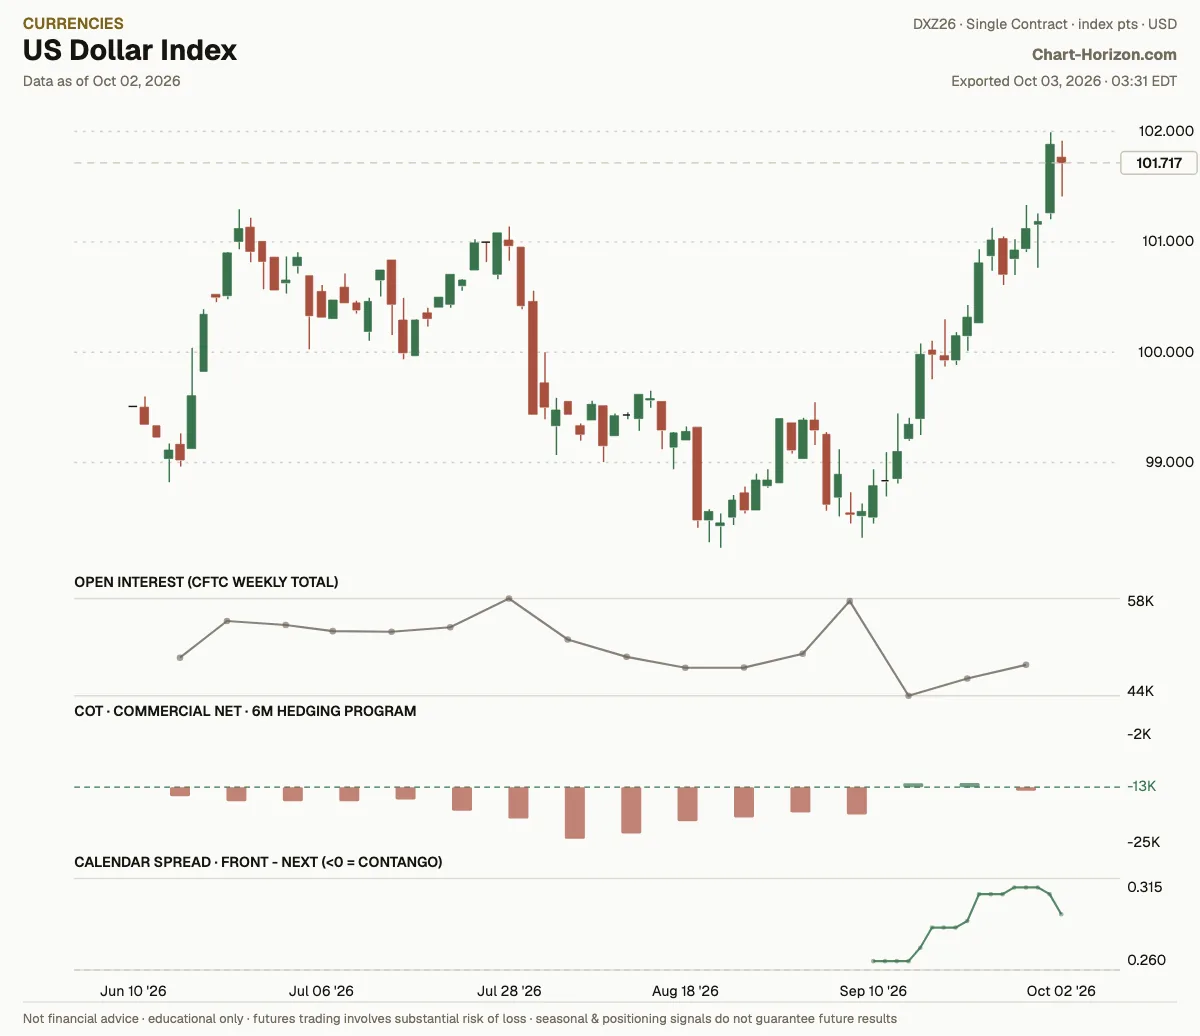
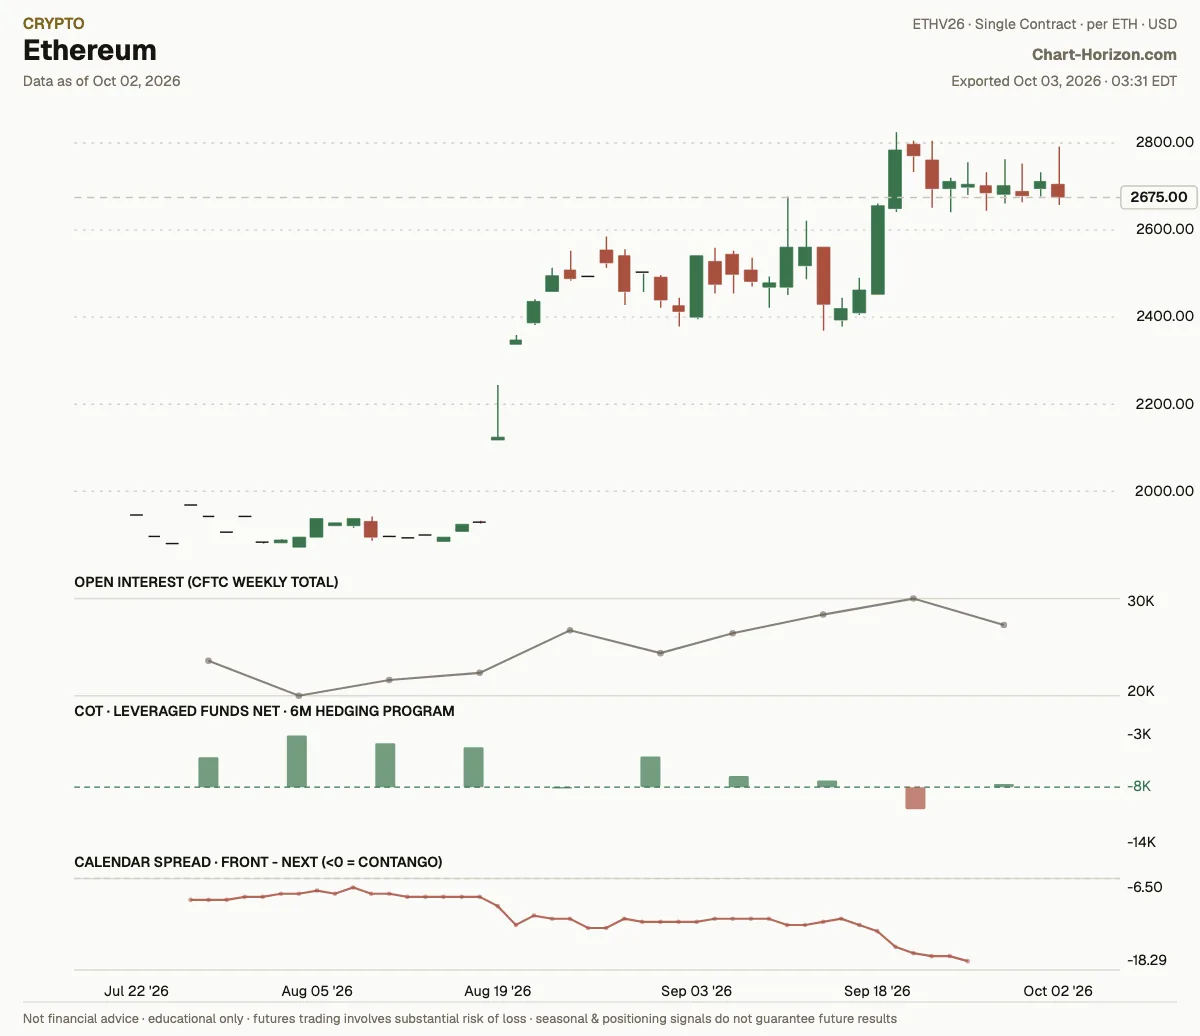
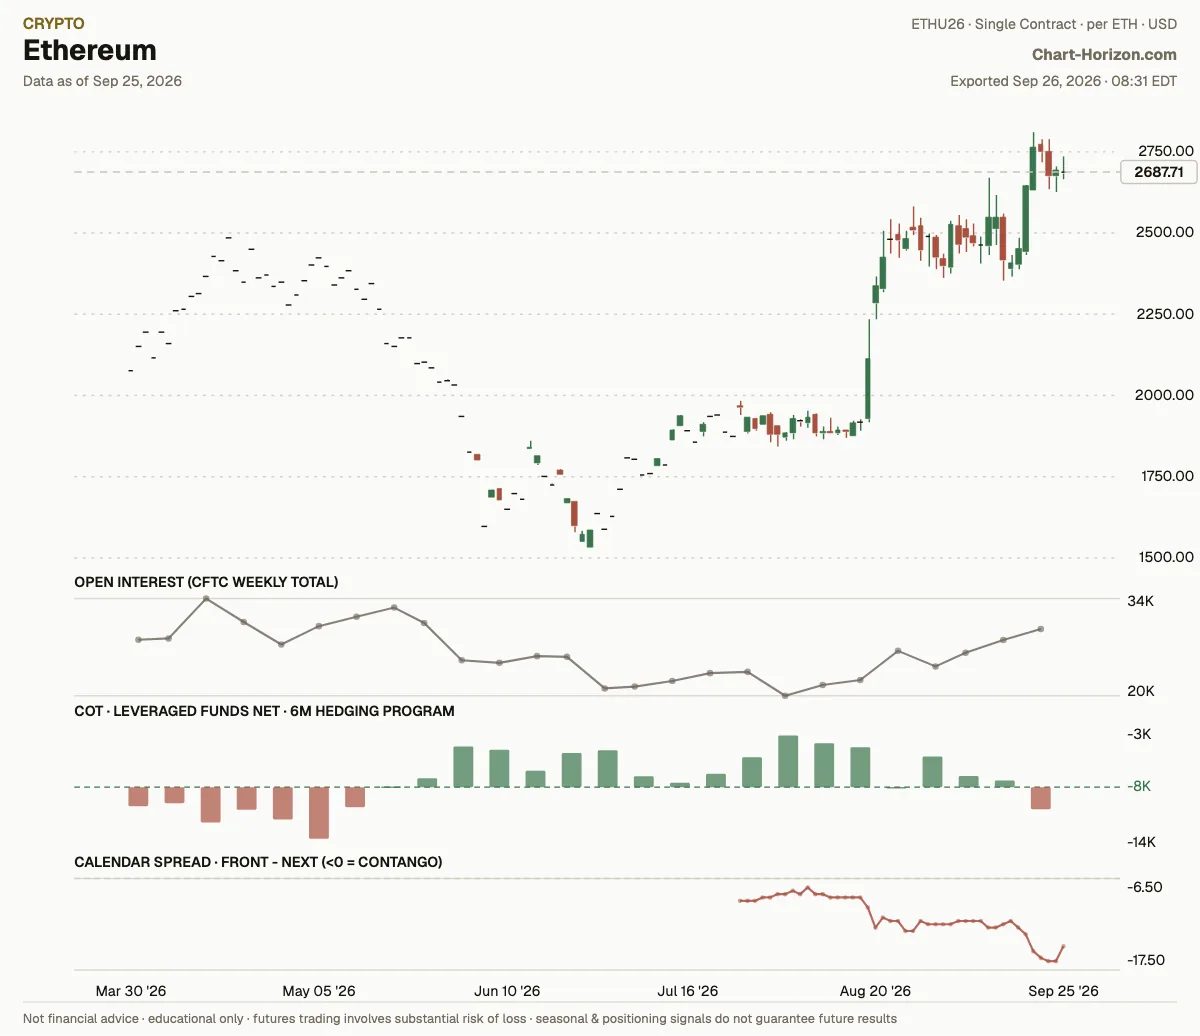
]]>ChartHorizonNew Hedger Highs in Platinum and Russell 20002026-10-03T00:00:00+02:002026-10-03T00:00:00+02:00https://chart-horizon.com/2026/10/03/hedgers-ledgerThe report dated 2026-09-29 puts ten markets at a three-year positioning extreme: five at highs, five at lows. Four of them set fresh window records with this report, Lean Hogs and Class III Milk on the high side, the 2-Year U.S. T-Note and Sugar on the low; in the 2-Year the commercial book is still net long, but the least long it has been in three years. Last week’s third record, the 5-Year T-Note, stays on the list at the 2nd percentile. Three markets are new to it: Platinum and the E-mini Russell 2000 at highs, and the 2-Year T-Note at a low, back after a week off the list. Four left it since last week: Coffee, Copper, Cotton and Soybeans. None of the three programs that crossed their six-month midpoint below, Gold, the US Dollar Index and Ethereum, is among the ten.
Percentile is where this week’s net sits inside its own 3-year range. How the desk reads positioning: About the desk.
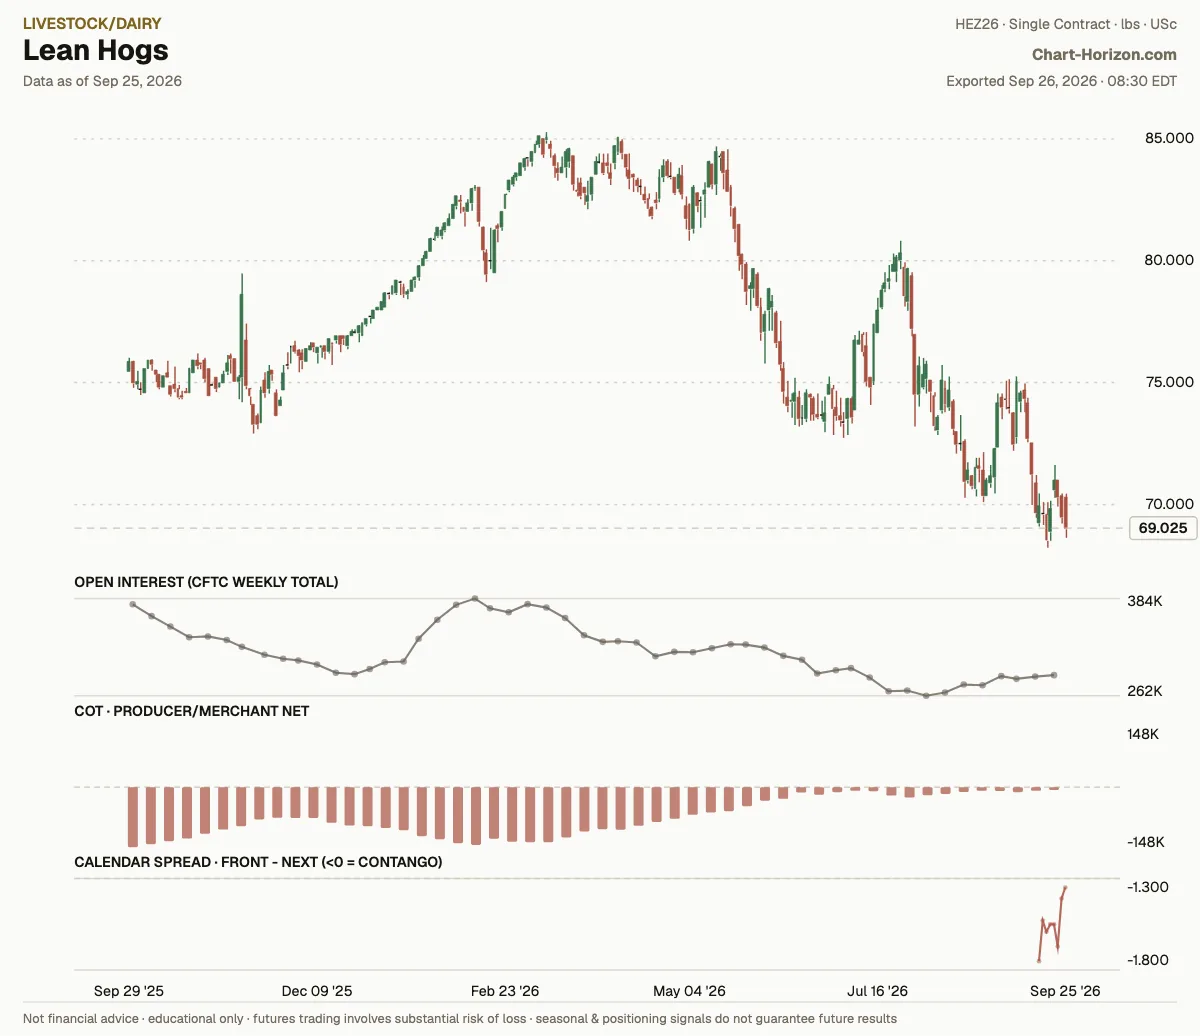
Lean Hogs: commercials at a 3-year high, a fresh record
Producer/Merchant Net sits at the 100th percentile of its ~3-year range. The commercials (the hedgers) have covered shorts toward the least-short end of the window; the book is still net short. That is a fresh record for the window. Net: -3,019 contracts (as of 2026-09-29).
Class III Milk: commercials at a 3-year high, a fresh record
Producer/Merchant Net sits at the 100th percentile of its ~3-year range. The commercials have been heavy net buyers. That is a fresh record for the window. Net: +10,429 contracts (as of 2026-09-29).
2-Year U.S. T-Note: commercials at a 3-year low, a fresh record
Commercial Net sits at the 1st percentile of its ~3-year range. The commercials have shed longs toward the least-long end of the window; the book is still net long. That is a fresh record for the window. Net: +752,017 contracts (as of 2026-09-29). New this week.
Sugar #11: commercials at a 3-year low, a fresh record
Producer/Merchant Net sits at the 1st percentile of its ~3-year range. The commercials have been heavy net sellers. That is a fresh record for the window. Net: -345,358 contracts (as of 2026-09-29).
Platinum: commercials at a 3-year high
Producer/Merchant Net sits at the 99th percentile of its ~3-year range. The commercials have covered shorts toward the least-short end of the window; the book is still net short. Net: -9,223 contracts (as of 2026-09-29). New this week.
5-Year U.S. T-Note: commercials at a 3-year low
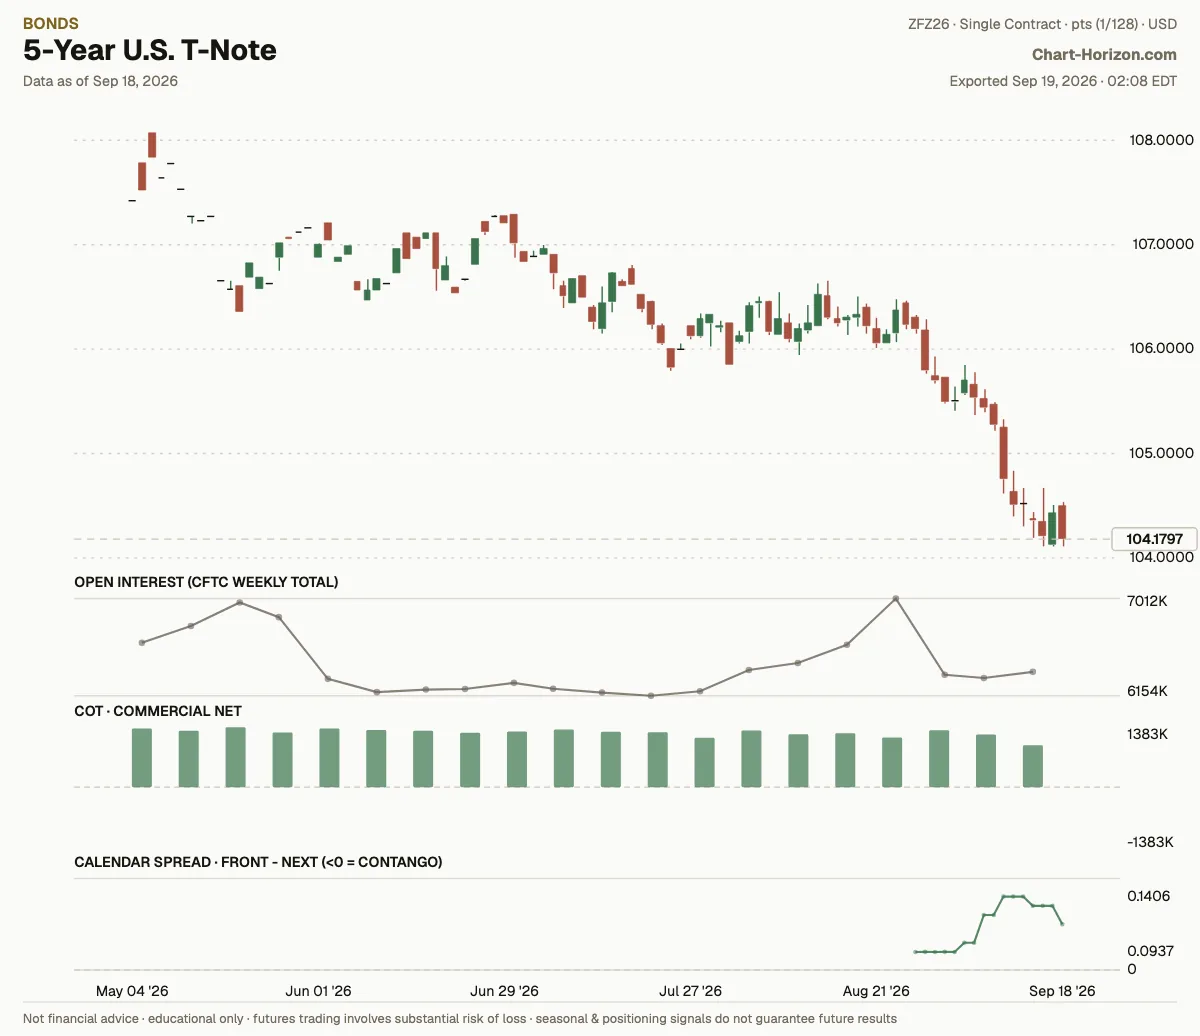
Commercial Net sits at the 2nd percentile of its ~3-year range. The commercials have shed longs toward the least-long end of the window; the book is still net long. Net: +954,888 contracts (as of 2026-09-29).
British Pound: commercials at a 3-year high
Commercial Net sits at the 98th percentile of its ~3-year range. The commercials have been heavy net buyers. Net: +100,882 contracts (as of 2026-09-29).
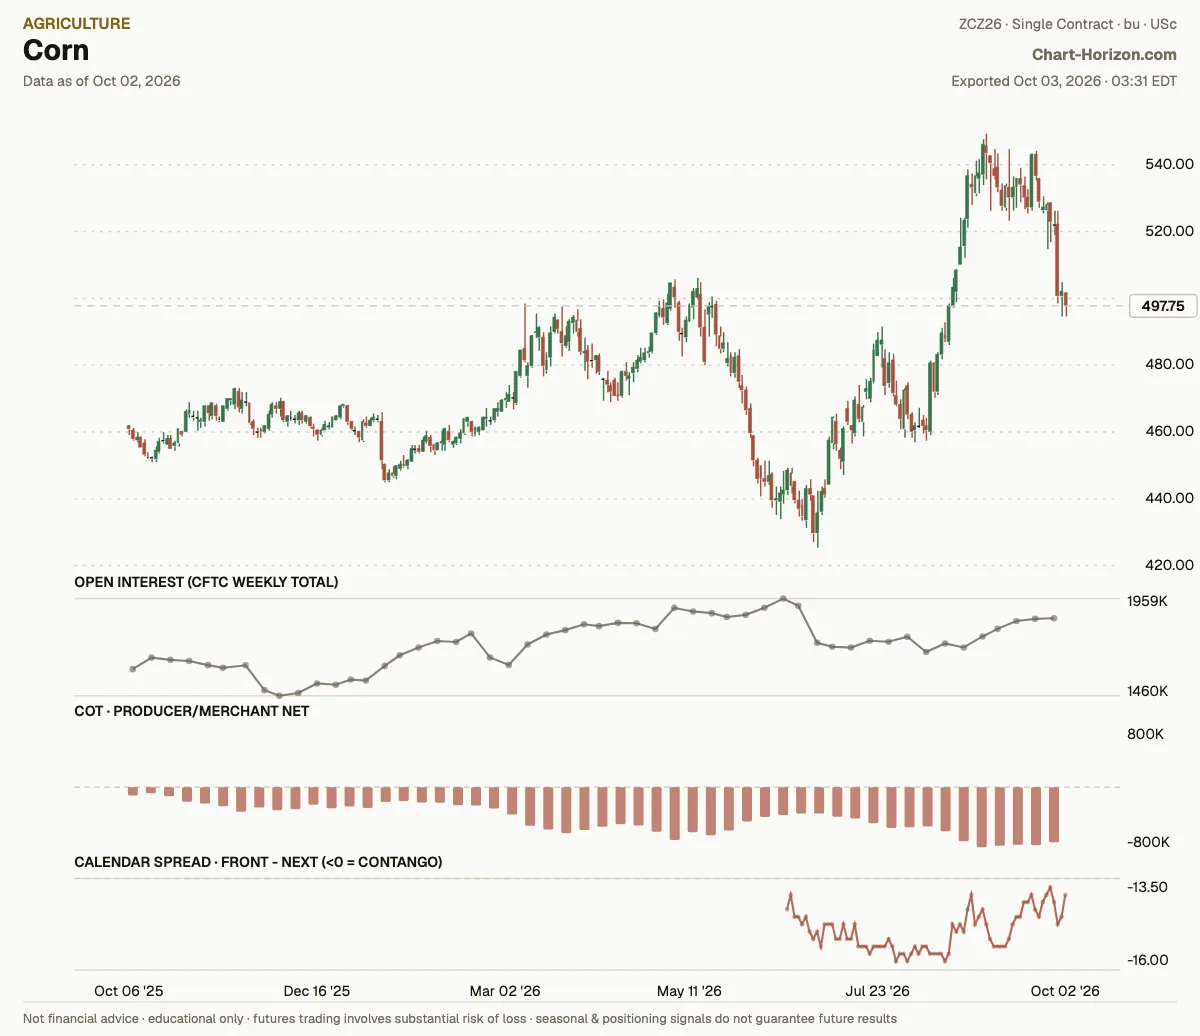
Corn: commercials at a 3-year low
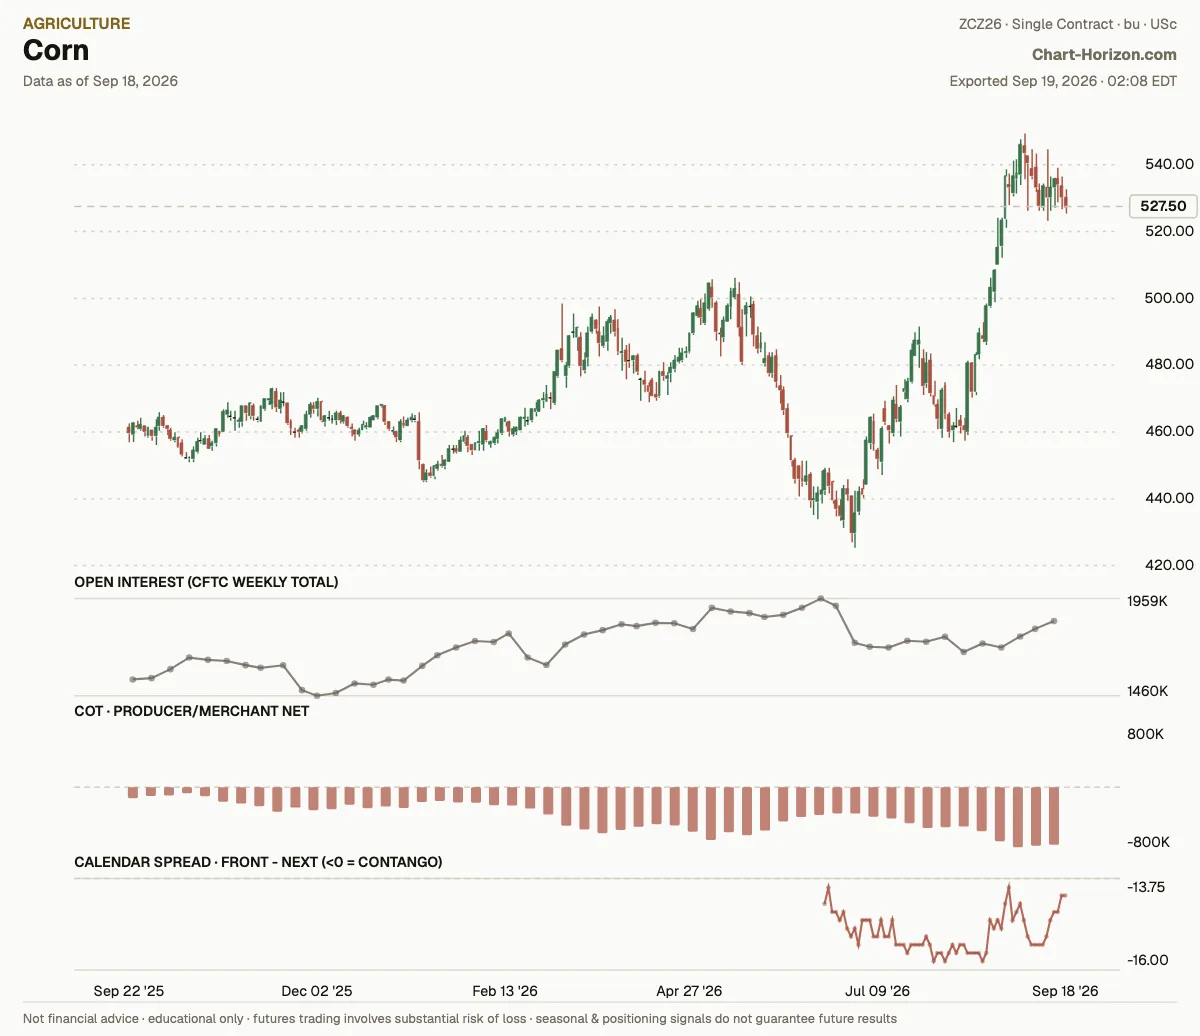
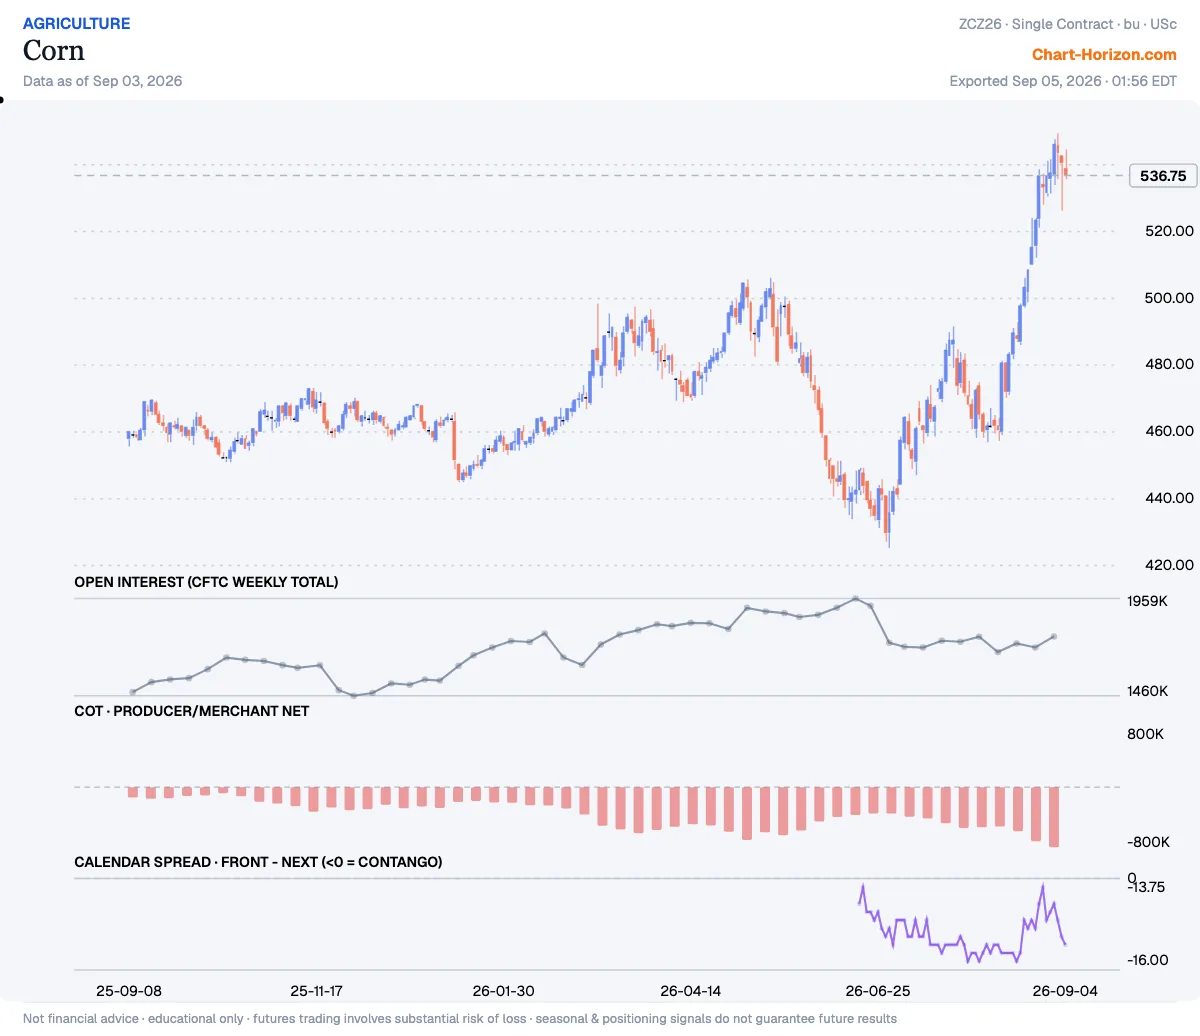
Producer/Merchant Net sits at the 3rd percentile of its ~3-year range. The commercials have been heavy net sellers. Net: -732,985 contracts (as of 2026-09-29).
E-mini Nasdaq 100: commercials at a 3-year low
Commercial Net sits at the 4th percentile of its ~3-year range. The commercials have been heavy net sellers. Net: -61,591 contracts (as of 2026-09-29).
E-mini Russell 2000: commercials at a 3-year high
Commercial Net sits at the 96th percentile of its ~3-year range. The commercials have been heavy net buyers. Net: +70,212 contracts (as of 2026-09-29). New this week.
The hedging program
Where each market’s tracked COT net sits inside its own trailing six-month range: above the midpoint of that range or below it. This is the same positioning read at close quarters, and it answers a different question from the extremes above: a book can sit at a three-year low and still have been working higher for six months. What follows is only what MOVED: the markets that crossed that midpoint with this week’s report.
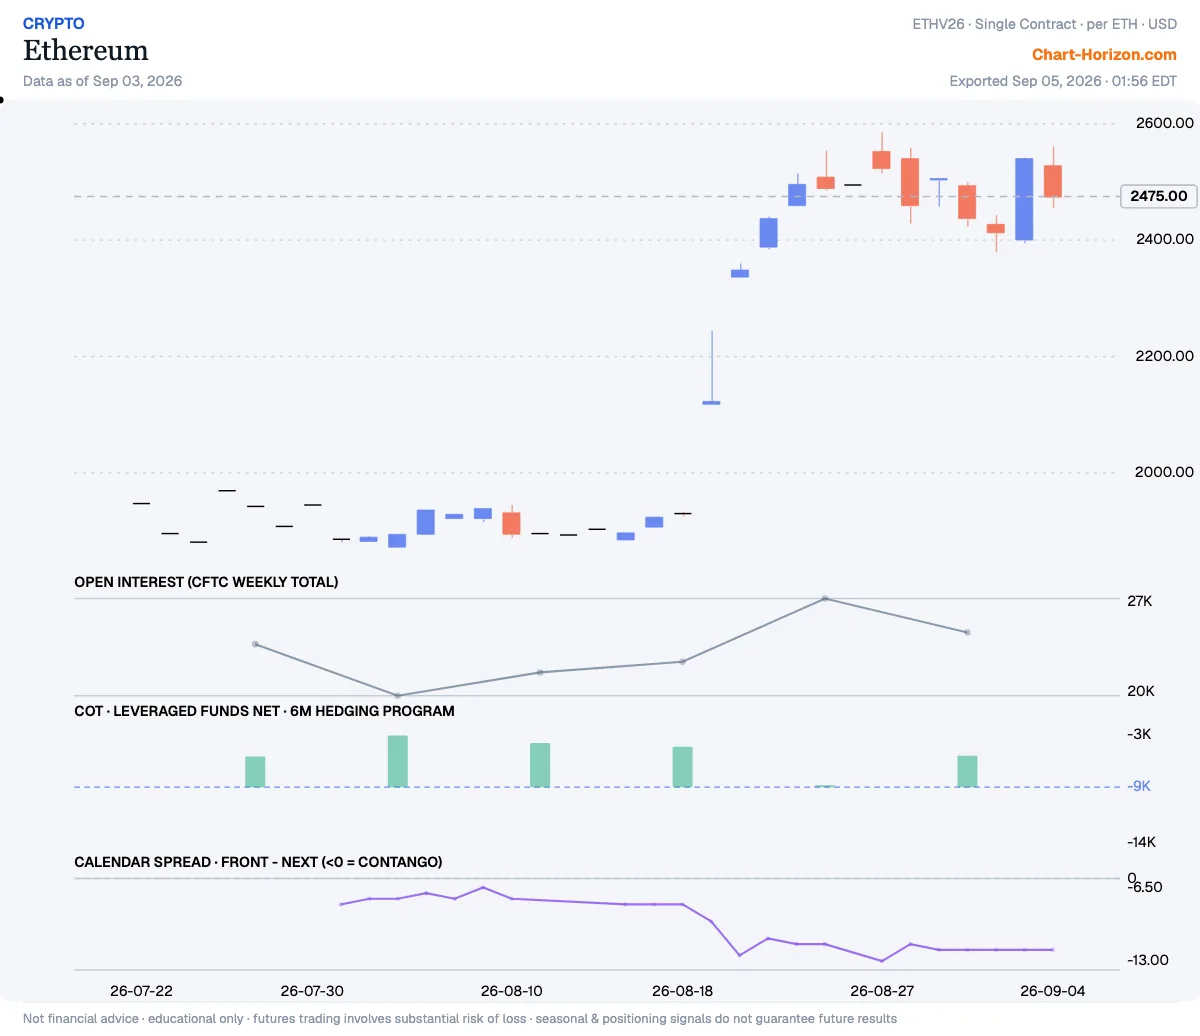
21 programs read above the midpoint of their own trailing six-month range this week, 18 below. Three crossed it with this report: Gold from below to above, US Dollar Index from above to below and Ethereum from below to above.
In the CFTC report of 2026-09-29, Producer/Merchant Net crossed the midpoint of its own trailing six-month range: it now sits above that midpoint, where the previous report still had it below. It cleared that midpoint by 2.7% of the window’s own range.
US Dollar Index: the program turns bearish
In the CFTC report of 2026-09-29, Commercial Net crossed the midpoint of its own trailing six-month range: it now sits below that midpoint, where the previous report still had it above. It cleared that midpoint by 3.4% of the window’s own range.
Ethereum: the program turns bullish
In the CFTC report of 2026-09-29, Leveraged Funds Net crossed the midpoint of its own trailing six-month range: it now sits above that midpoint, where the previous report still had it below. It cleared that midpoint by 3.0% of the window’s own range. The book tracked here is leveraged funds, a speculative cohort, not the hedger side.
]]>ChartHorizonNew Hedger Highs in Coffee and Sterling; New Lows in Nasdaq 1002026-09-26T00:00:00+02:002026-09-26T00:00:00+02:00https://chart-horizon.com/2026/09/26/hedgers-ledgerThe report dated 2026-09-22 puts eleven markets at a three-year positioning extreme: seven at lows, four at highs. Three of them set fresh window records, Lean Hogs and Class III Milk on the high side and the 5-Year U.S. T-Note on the low, where the commercial book is still net long but the least long it has been in three years. Four markets are new to the list: Coffee and the British Pound at highs, the E-mini Nasdaq 100 and Copper at lows. Four left it since last week: Wheat, the 2-Year T-Note, the 30-Year T-Bond and Bitcoin. The British Pound is the one market in both halves of this issue, a new three-year extreme and one of the five programs below that crossed their six-month midpoint with this report.
Percentile is where this week’s net sits inside its own 3-year range. How the desk reads positioning: About the desk.
Lean Hogs: commercials at a 3-year high, a fresh record
Producer/Merchant Net sits at the 100th percentile of its ~3-year range. The commercials (the hedgers) have covered shorts toward the least-short end of the window; the book is still net short. That is a fresh record for the window. Net: -6,997 contracts (as of 2026-09-22).
Class III Milk: commercials at a 3-year high, a fresh record
Producer/Merchant Net sits at the 100th percentile of its ~3-year range. The commercials have been heavy net buyers. That is a fresh record for the window. Net: +8,351 contracts (as of 2026-09-22).
5-Year U.S. T-Note: commercials at a 3-year low, a fresh record
Commercial Net sits at the 1st percentile of its ~3-year range. The commercials have shed longs toward the least-long end of the window; the book is still net long. That is a fresh record for the window. Net: +840,022 contracts (as of 2026-09-22).
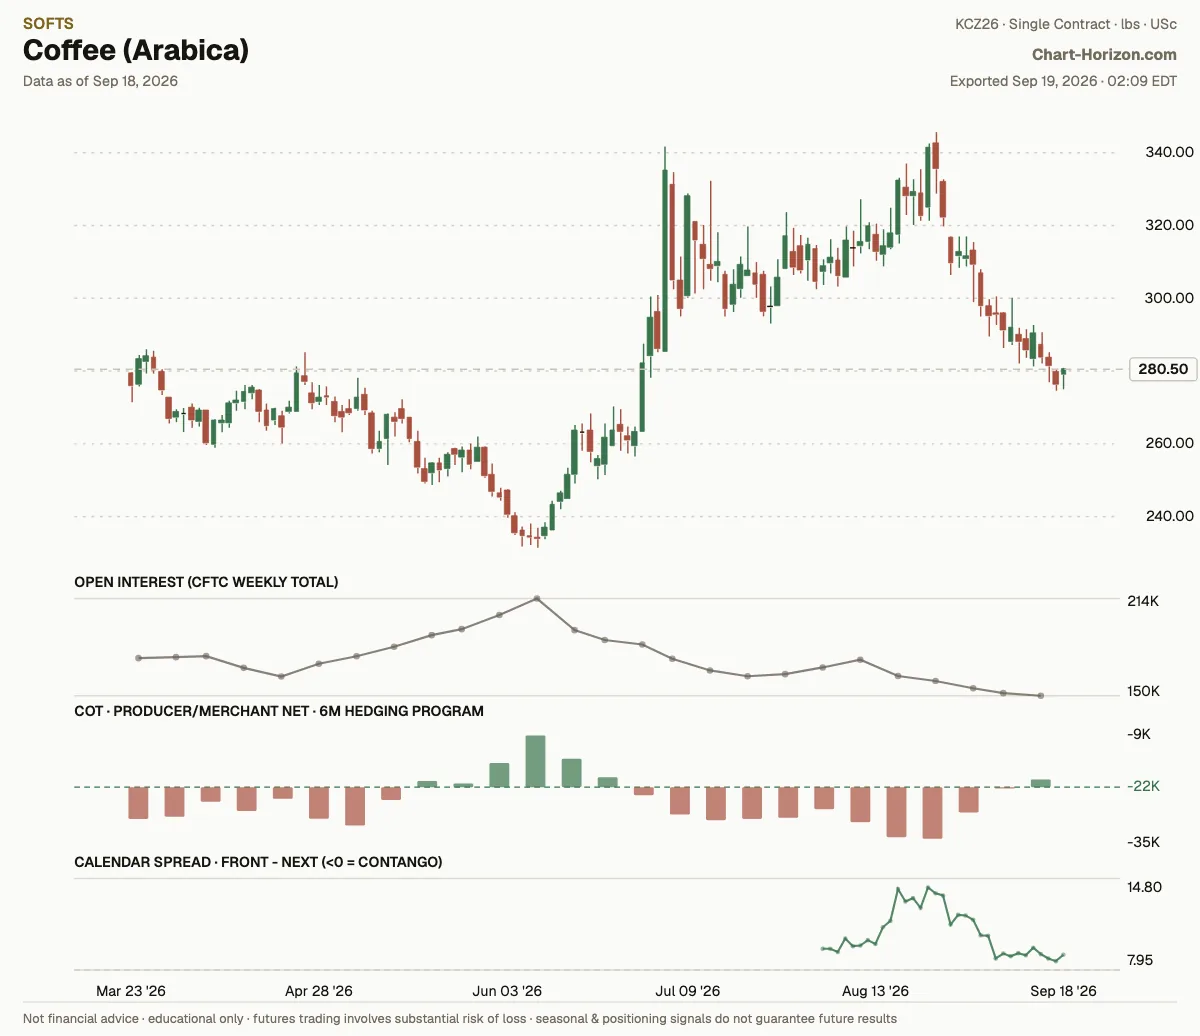
Coffee (Arabica): commercials at a 3-year high
Producer/Merchant Net sits at the 99th percentile of its ~3-year range. The commercials have covered shorts toward the least-short end of the window; the book is still net short. Net: -12,534 contracts (as of 2026-09-22). New this week.
E-mini Nasdaq 100: commercials at a 3-year low
Commercial Net sits at the 1st percentile of its ~3-year range. The commercials have been heavy net sellers. Net: -65,763 contracts (as of 2026-09-22). New this week.
Sugar #11: commercials at a 3-year low
Producer/Merchant Net sits at the 1st percentile of its ~3-year range. The commercials have been heavy net sellers. Net: -340,141 contracts (as of 2026-09-22).
Corn: commercials at a 3-year low
Producer/Merchant Net sits at the 2nd percentile of its ~3-year range. The commercials have been heavy net sellers. Net: -773,483 contracts (as of 2026-09-22).
Copper: commercials at a 3-year low
Producer/Merchant Net sits at the 2nd percentile of its ~3-year range. The commercials have been heavy net sellers. Net: -112,575 contracts (as of 2026-09-22). New this week.
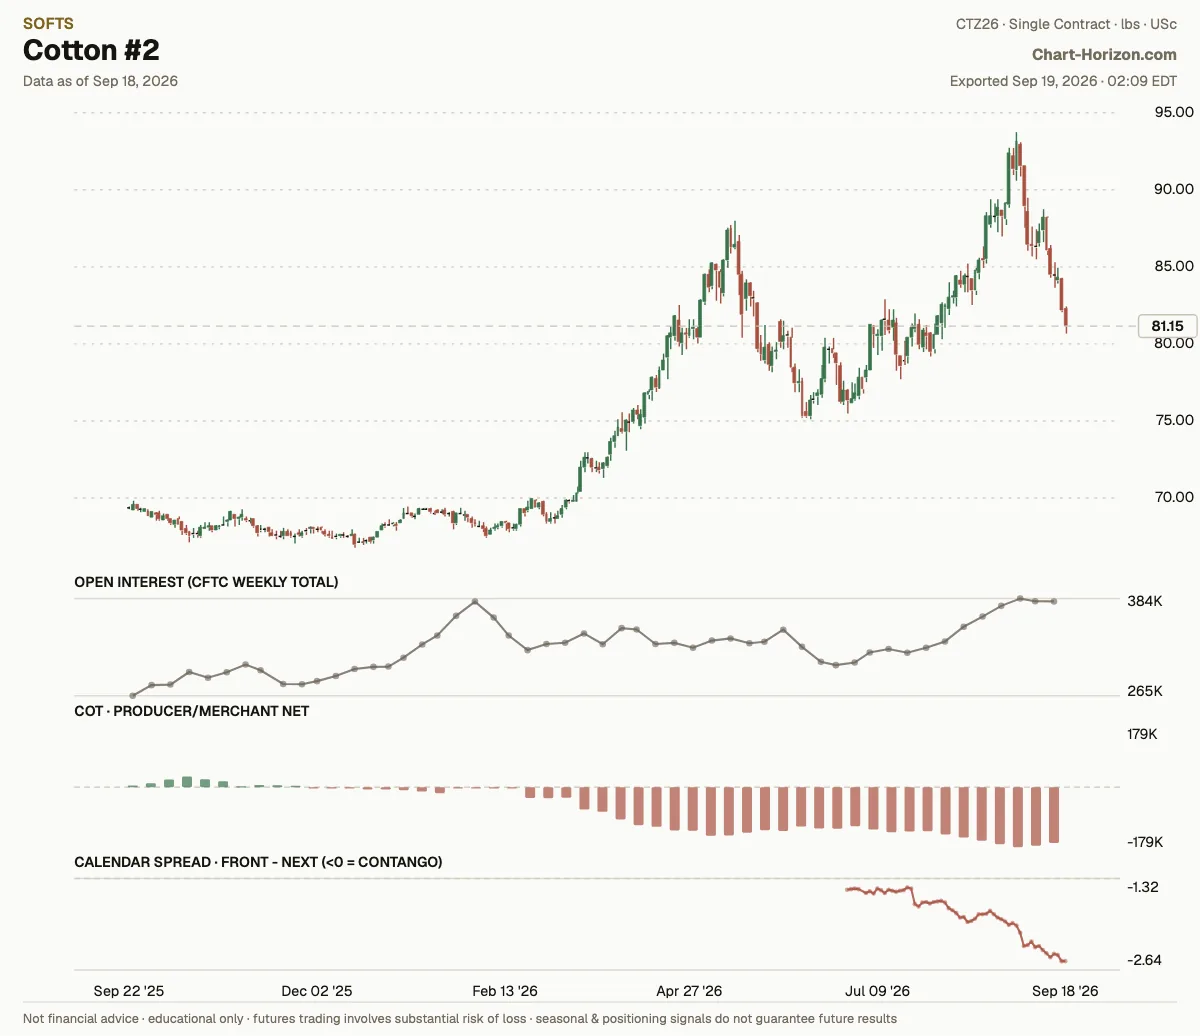
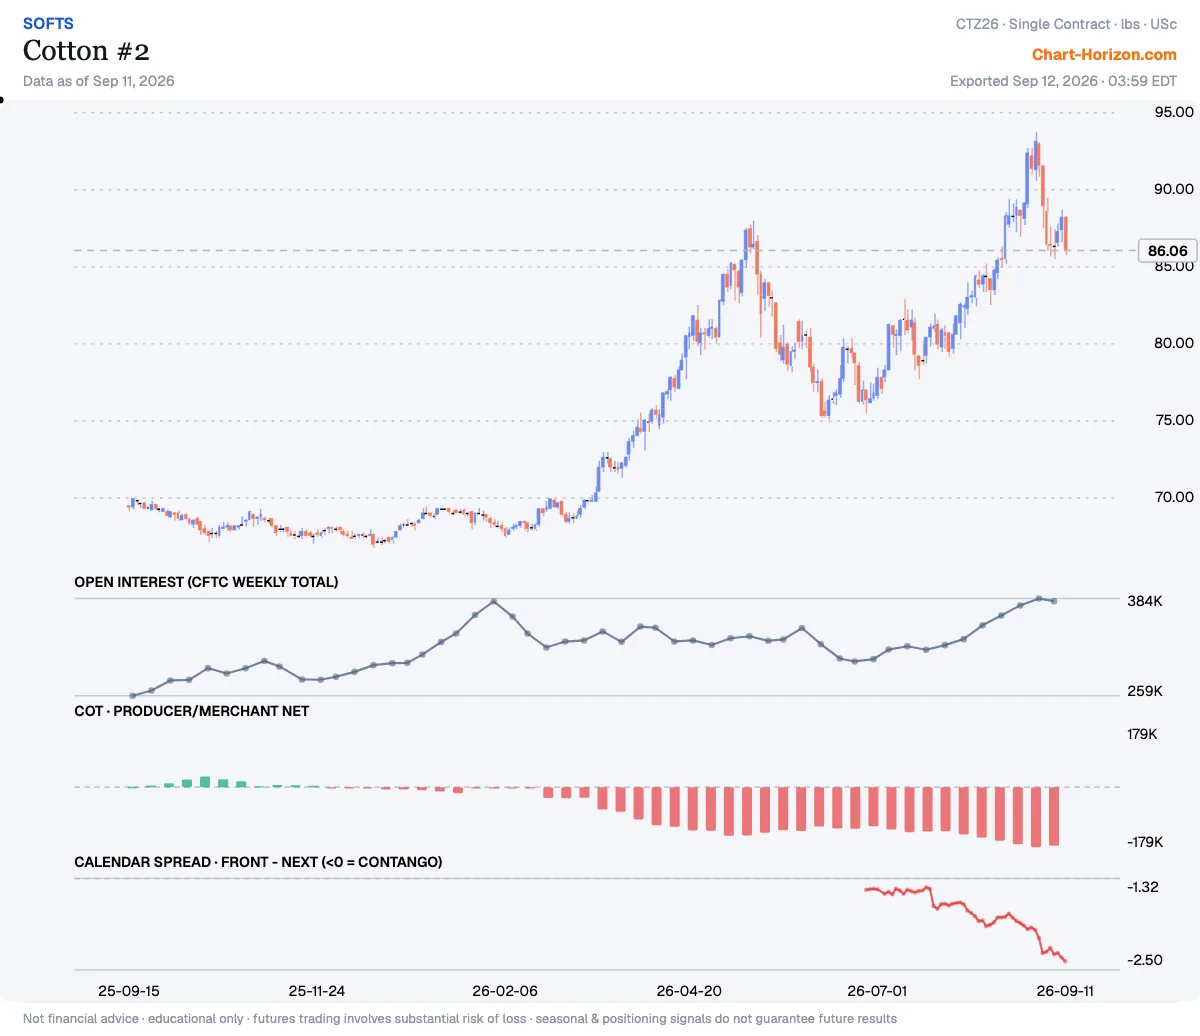
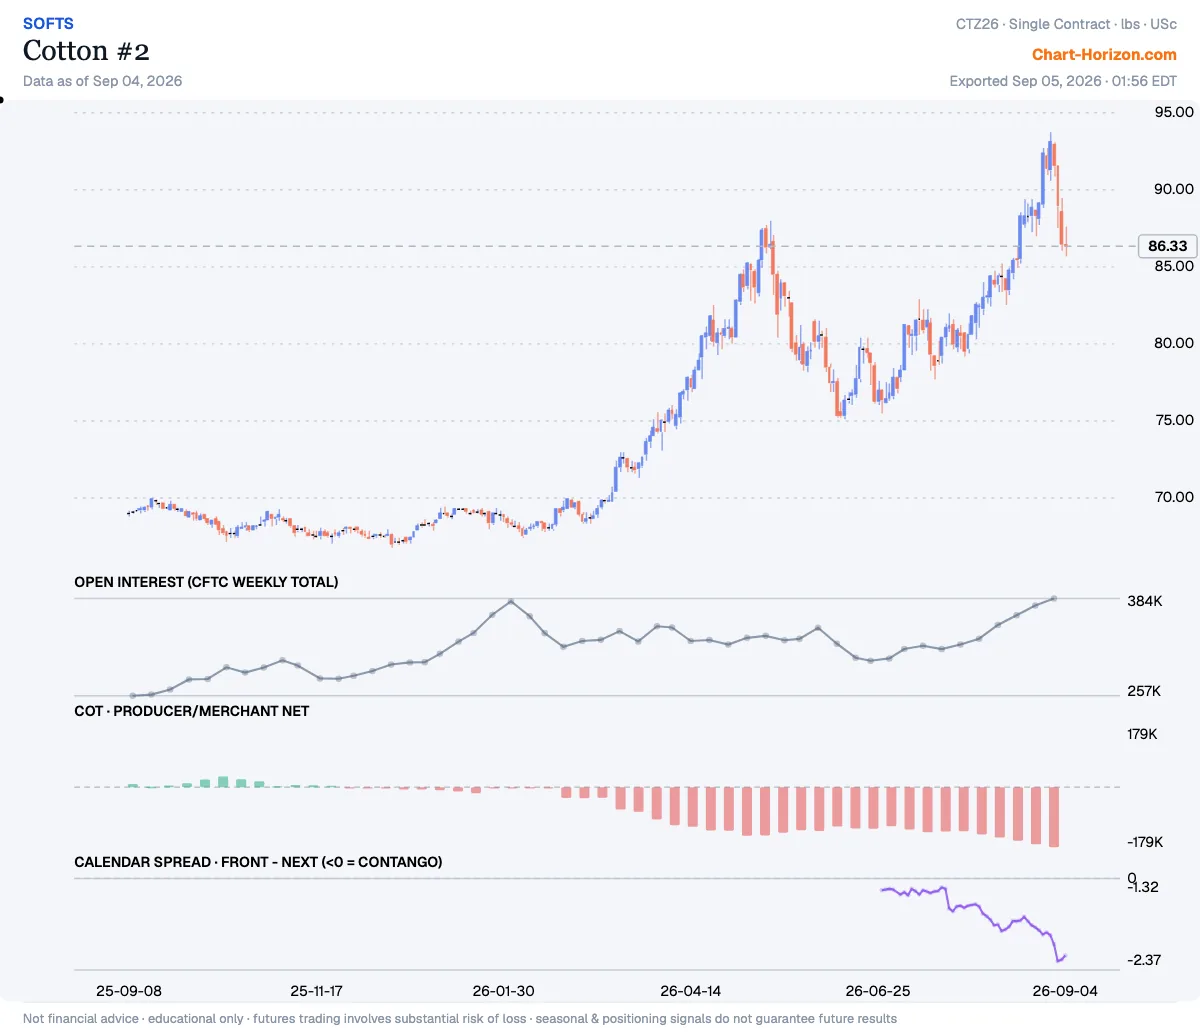
Cotton #2: commercials at a 3-year low
Producer/Merchant Net sits at the 4th percentile of its ~3-year range. The commercials have been heavy net sellers. Net: -154,611 contracts (as of 2026-09-22).
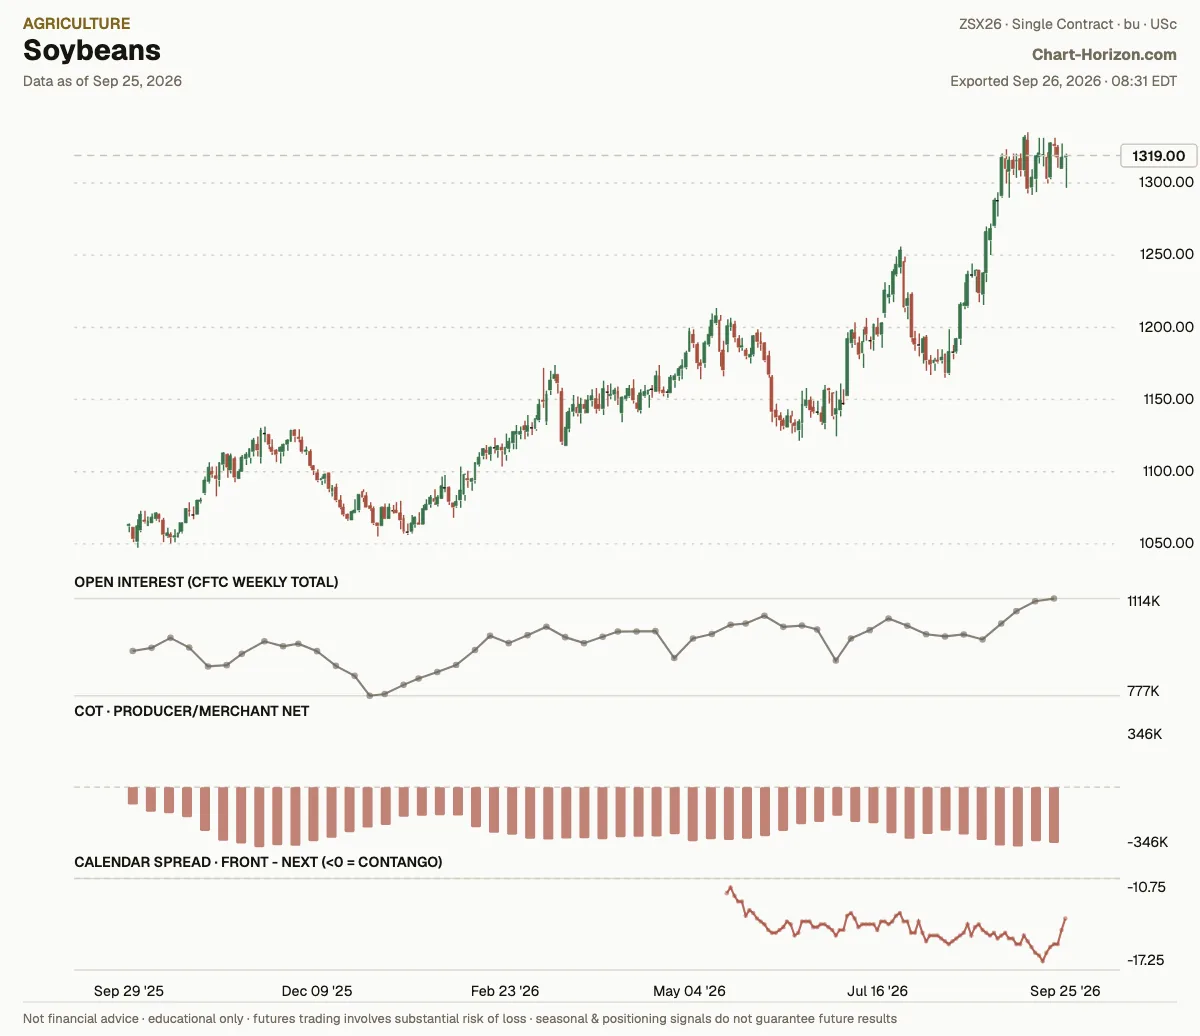
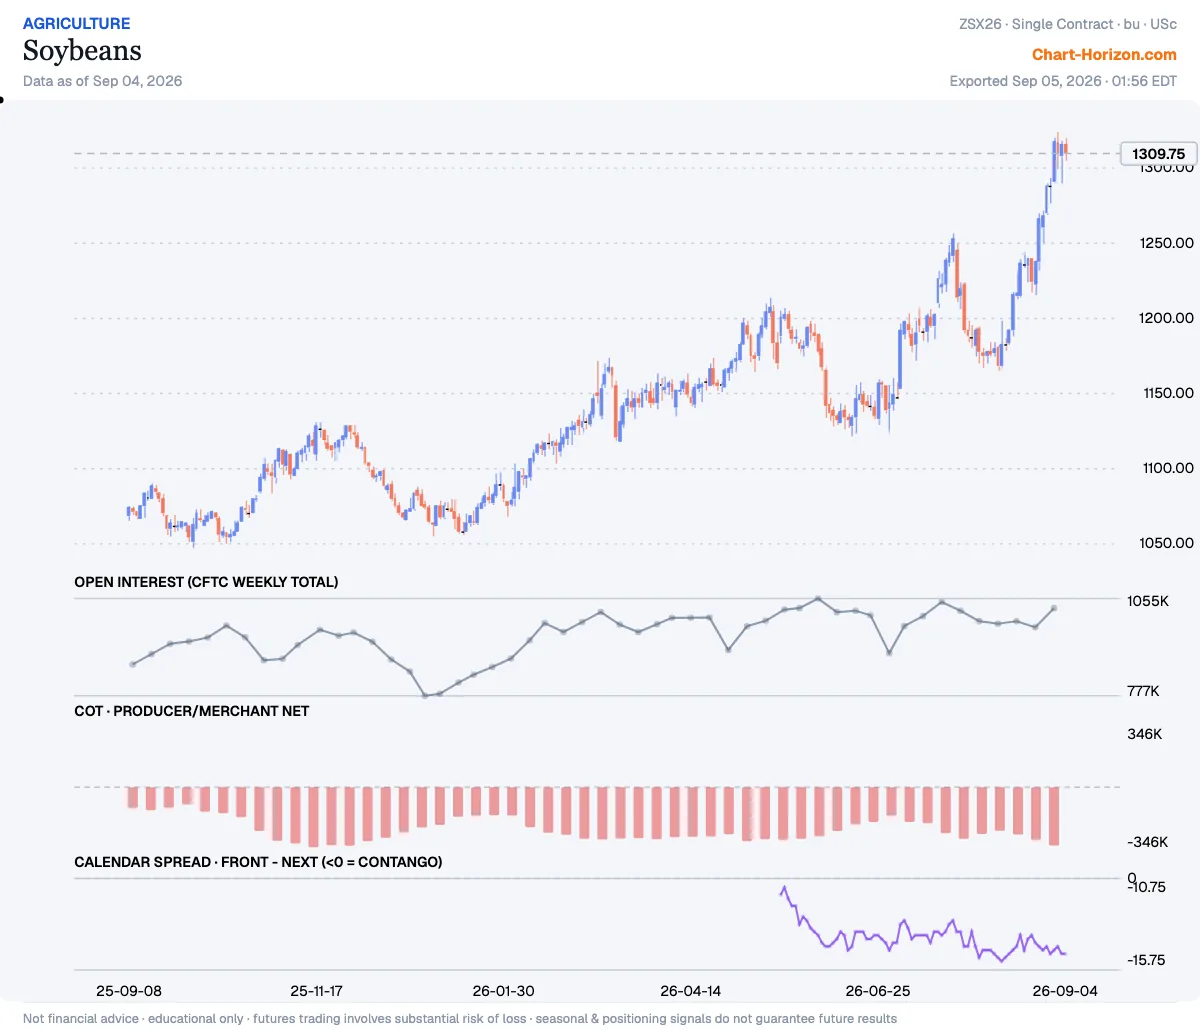
Soybeans: commercials at a 3-year low
Producer/Merchant Net sits at the 4th percentile of its ~3-year range. The commercials have been heavy net sellers. Net: -322,240 contracts (as of 2026-09-22).
British Pound: commercials at a 3-year high
Commercial Net sits at the 96th percentile of its ~3-year range. The commercials have been heavy net buyers. Net: +87,680 contracts (as of 2026-09-22). New this week.
The hedging program
Where each market’s tracked COT net sits inside its own trailing six-month range: above the midpoint of that range or below it. This is the same positioning read at close quarters, and it answers a different question from the extremes above: a book can sit at a three-year low and still have been working higher for six months. What follows is only what MOVED: the markets that crossed that midpoint with this week’s report.
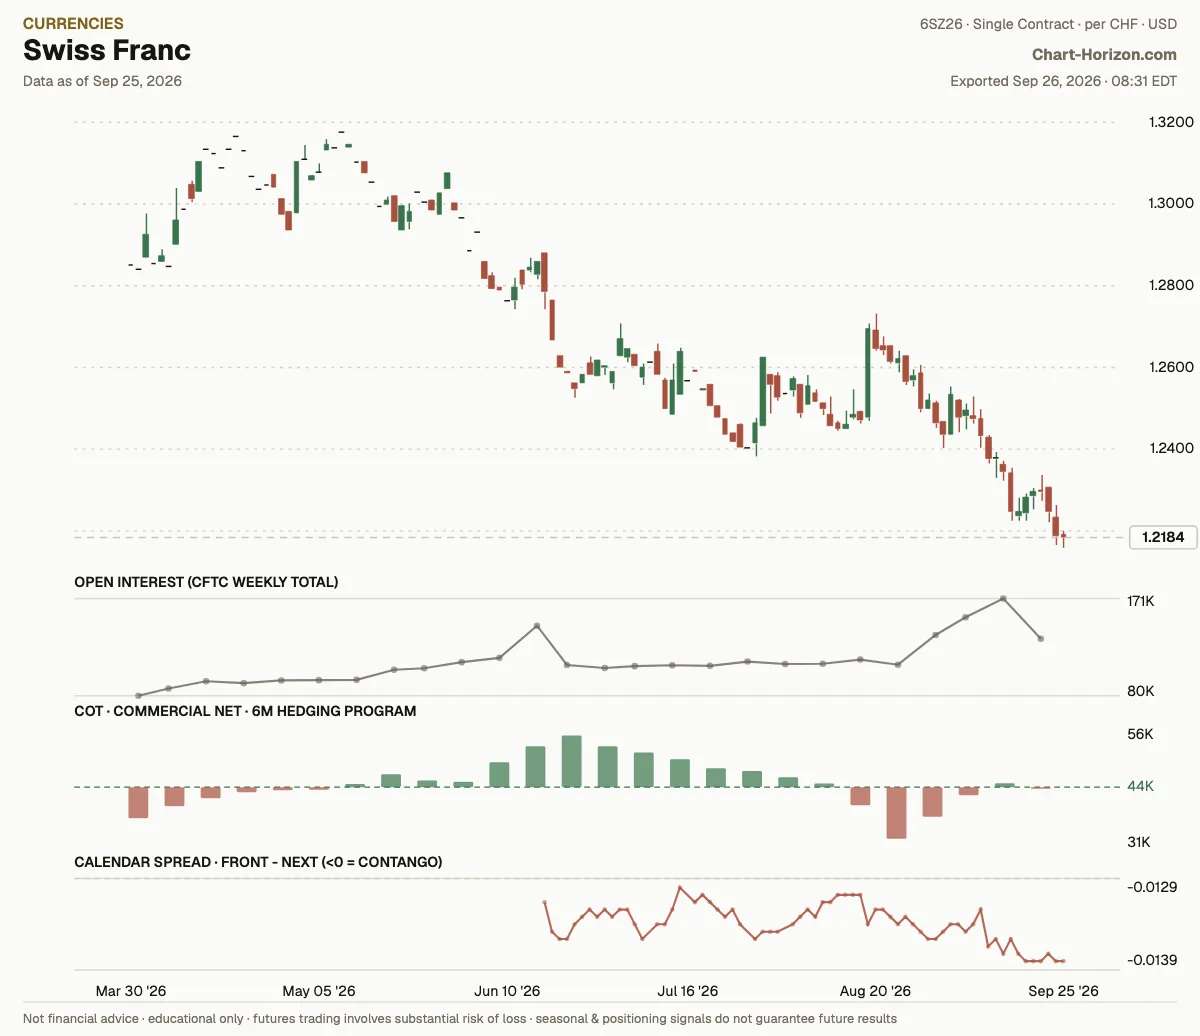
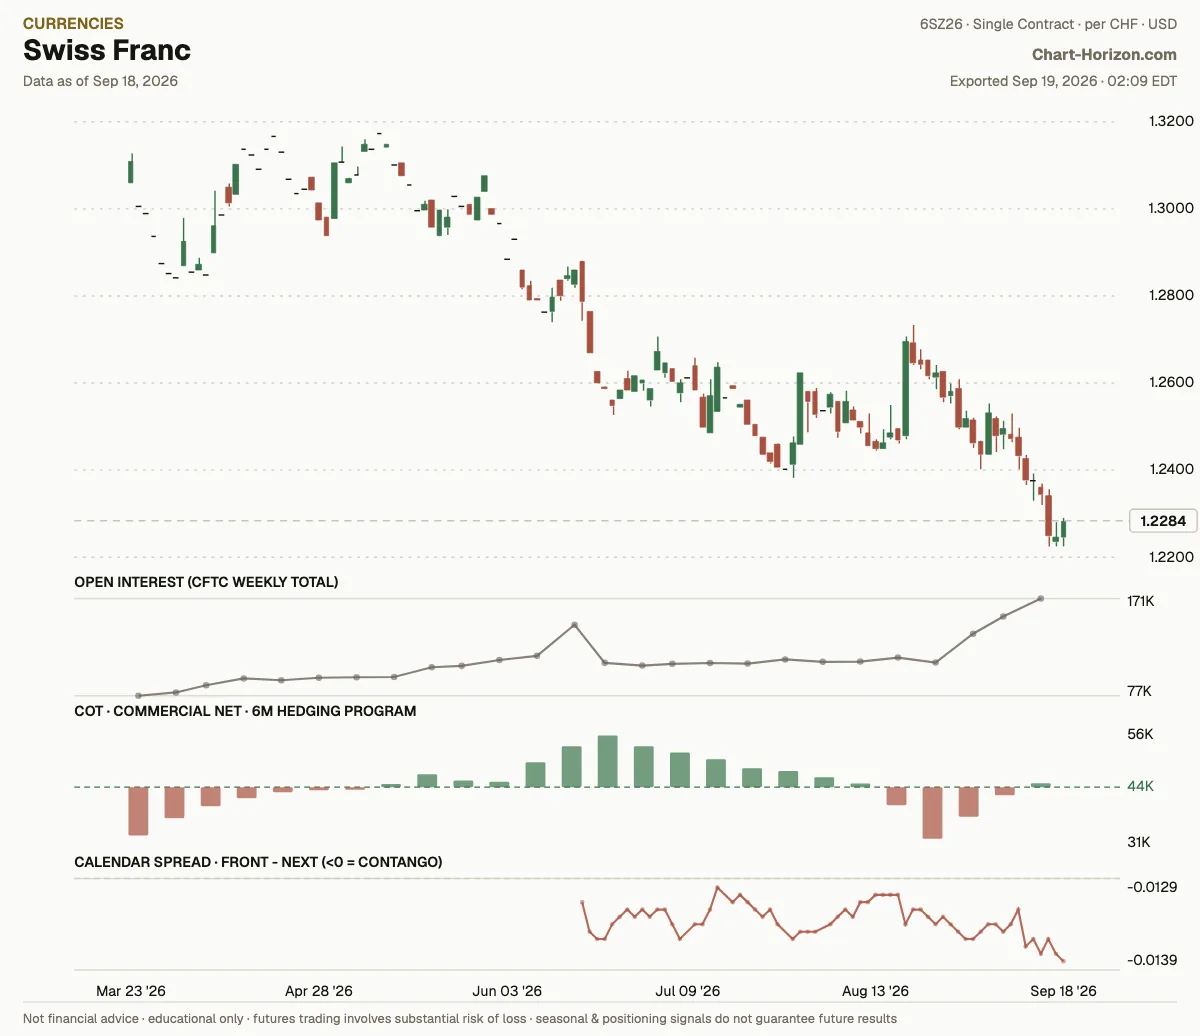
20 programs read above the midpoint of their own trailing six-month range this week, 19 below. Five crossed it with this report: Soybean Oil from below to above, Cocoa from below to above, British Pound from below to above, Swiss Franc from above to below and Ethereum from above to below.
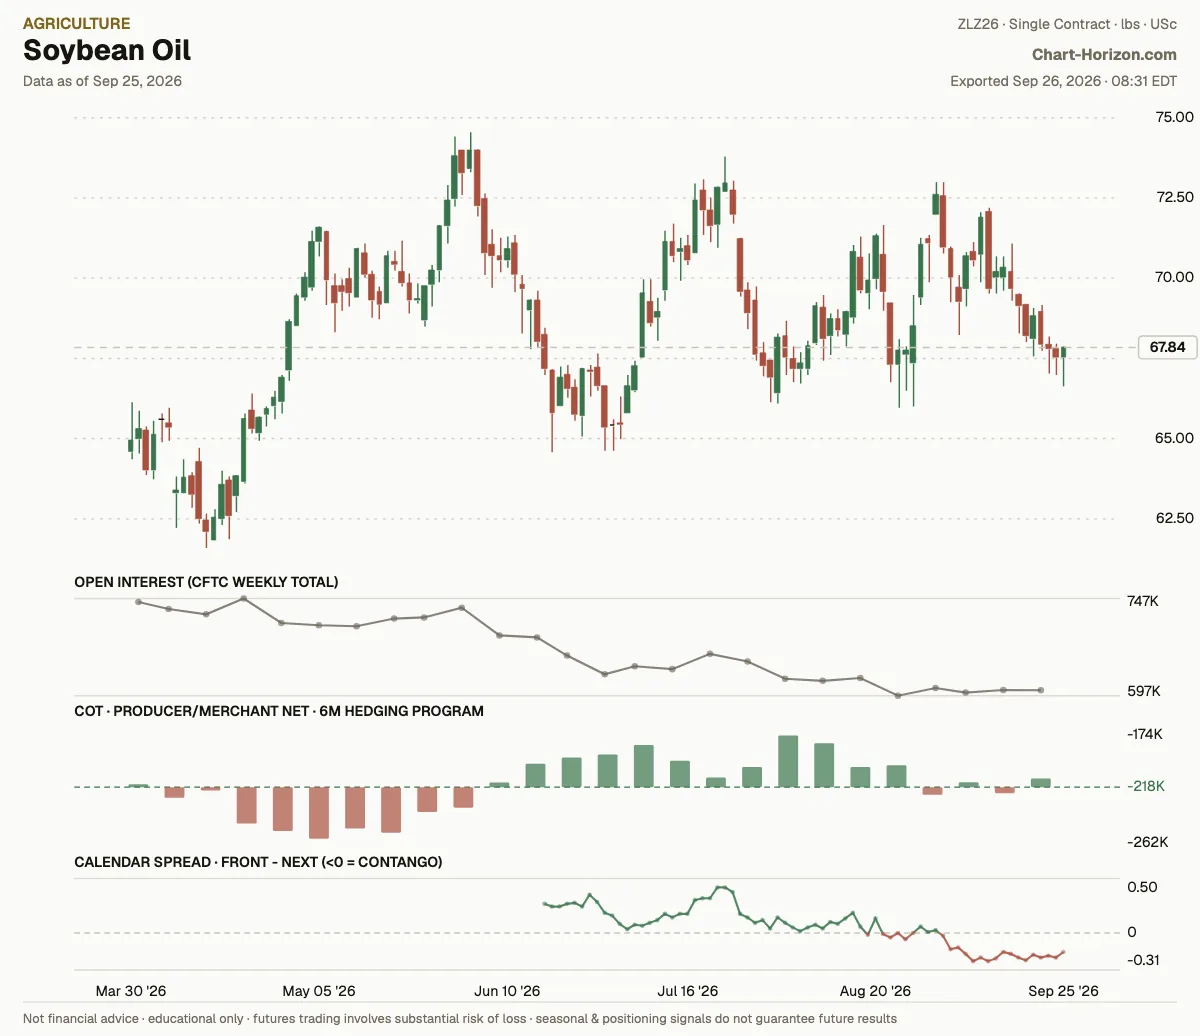
In the CFTC report of 2026-09-22, Producer/Merchant Net crossed the midpoint of its own trailing six-month range: it now sits above that midpoint, where the previous report still had it below. It cleared that midpoint by 8.4% of the window’s own range.
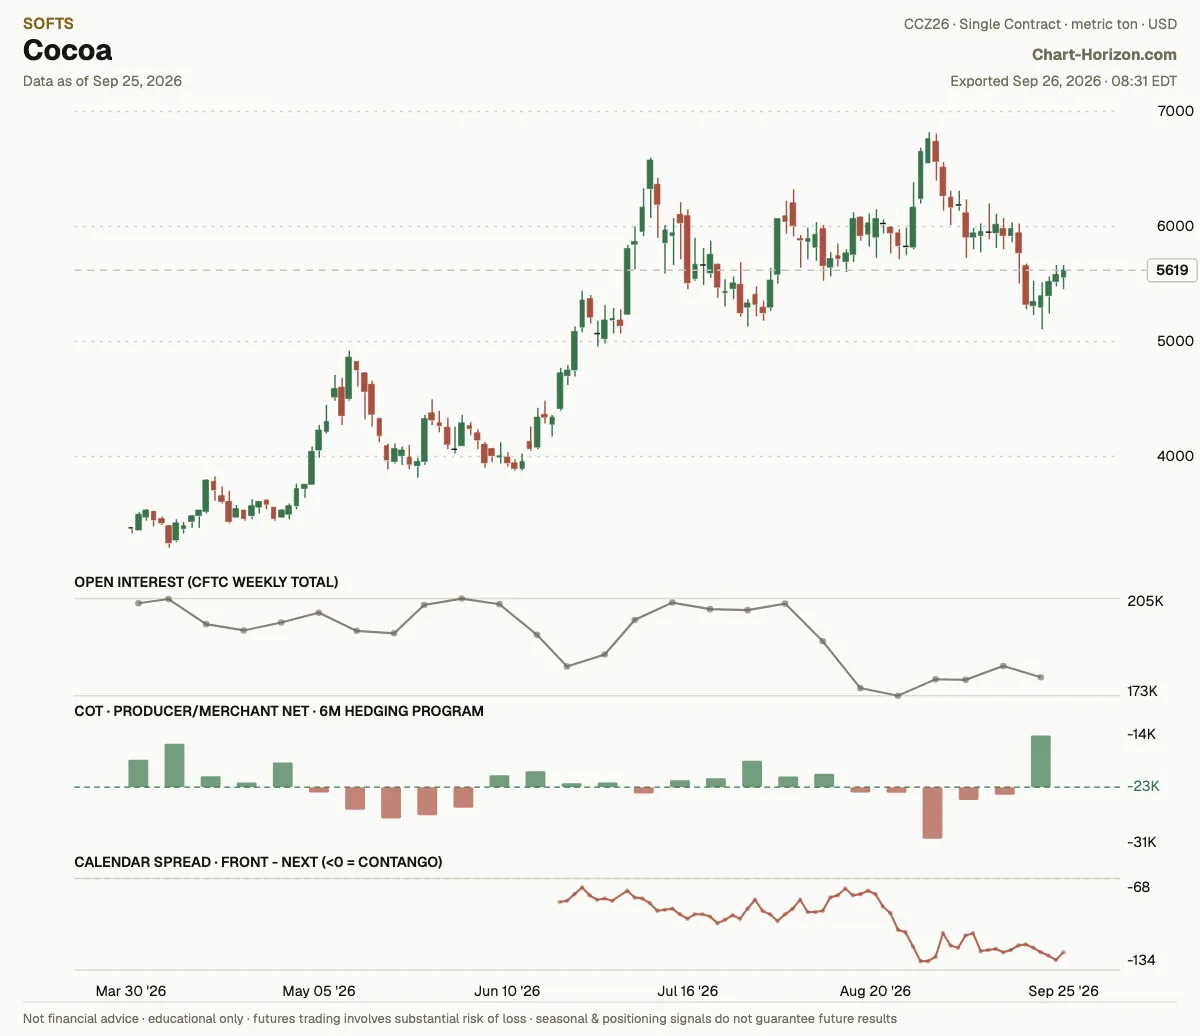
Cocoa: the program turns bullish
In the CFTC report of 2026-09-22, Producer/Merchant Net crossed the midpoint of its own trailing six-month range: it now sits above that midpoint, where the previous report still had it below. It cleared that midpoint by 50.0% of the window’s own range.
British Pound: the program turns bullish
In the CFTC report of 2026-09-22, Commercial Net crossed the midpoint of its own trailing six-month range: it now sits above that midpoint, where the previous report still had it below. It cleared that midpoint by 7.8% of the window’s own range.
Swiss Franc: the program turns bearish
In the CFTC report of 2026-09-22, Commercial Net crossed the midpoint of its own trailing six-month range: it now sits below that midpoint, where the previous report still had it above. It cleared that midpoint by 1.5% of the window’s own range: a crossing on the definition, and a coin-flip in fact.
Ethereum: the program turns bearish
In the CFTC report of 2026-09-22, Leveraged Funds Net crossed the midpoint of its own trailing six-month range: it now sits below that midpoint, where the previous report still had it above. It cleared that midpoint by 21.4% of the window’s own range. The book tracked here is leveraged funds, a speculative cohort, not the hedger side.
]]>ChartHorizonNew Positioning Highs in Lean Hogs and Bitcoin2026-09-19T00:00:00+02:002026-09-19T00:00:00+02:00https://chart-horizon.com/2026/09/19/hedgers-ledgerThe hedger book dated 2026-09-15 runs heavily to one side: seven markets sit at positioning lows against only four at highs, and the short-lean is concentrated in the grains and soft commodities, where Corn, Wheat, Soybeans, Cotton, and Sugar all press toward the floor of their three-year ranges simultaneously. Two fresh window records were set this week, Class III Milk on the high side and Sugar on the low, and four markets are new entrants to the extreme list: Lean Hogs, Bitcoin, and the 5-Year and 2-Year T-Notes. The rates complex deserves a separate note: the 2-Year, 5-Year, and 30-Year each appear on this report, though they do not all lean the same direction, and the Bitcoin entry reflects a leveraged-fund cohort rather than commercial hedgers. None of the eleven turns up among the nine hedging-program crossings below: this week the three-year extremes and the six-month program are reading different markets.
Percentile is where this week’s net sits inside its own 3-year range. How the desk reads positioning: About the desk.
Class III Milk: commercials at a 3-year high, a fresh record
Producer/Merchant Net sits at the 100th percentile of its ~3-year range. The commercials (the hedgers) have been heavy net buyers. That is a fresh record for the window. Net: +7,282 contracts (as of 2026-09-15).
Sugar #11: commercials at a 3-year low, a fresh record
Producer/Merchant Net sits at the 1st percentile of its ~3-year range. The commercials have been heavy net sellers. That is a fresh record for the window. Net: -345,092 contracts (as of 2026-09-15).
Lean Hogs: commercials at a 3-year high
Producer/Merchant Net sits at the 99th percentile of its ~3-year range. The commercials have covered shorts toward the least-short end of the window; the book is still net short. Net: -9,107 contracts (as of 2026-09-15). New this week.
Corn: commercials at a 3-year low
Producer/Merchant Net sits at the 2nd percentile of its ~3-year range. The commercials have been heavy net sellers. Net: -770,306 contracts (as of 2026-09-15).
5-Year U.S. T-Note: commercials at a 3-year low
Commercial Net sits at the 2nd percentile of its ~3-year range. The commercials have shed longs toward the least-long end of the window; the book is still net long. Net: +964,380 contracts (as of 2026-09-15). New this week.
2-Year U.S. T-Note: commercials at a 3-year low
Commercial Net sits at the 2nd percentile of its ~3-year range. The commercials have shed longs toward the least-long end of the window; the book is still net long. Net: +807,950 contracts (as of 2026-09-15). New this week.
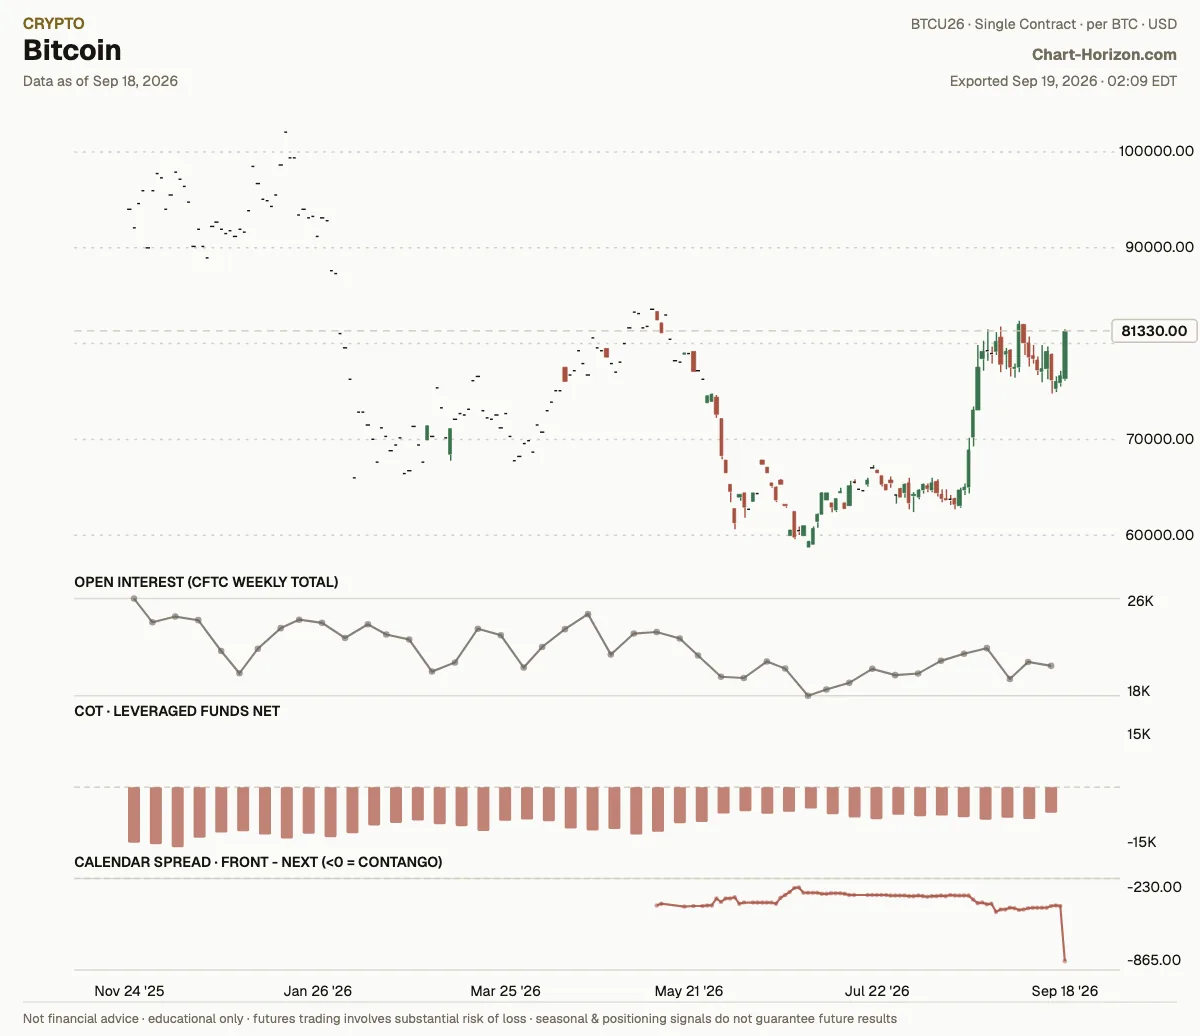
Bitcoin: leveraged funds at a 3-year high
Leveraged Funds Net sits at the 97th percentile of its ~3-year range. The leveraged funds (the fast, speculative money) have covered shorts toward the least-short end of the window; the book is still net short. Net: -6,354 contracts (as of 2026-09-15). New this week.
Cotton #2: commercials at a 3-year low
Producer/Merchant Net sits at the 3rd percentile of its ~3-year range. The commercials have been heavy net sellers. Net: -166,403 contracts (as of 2026-09-15).
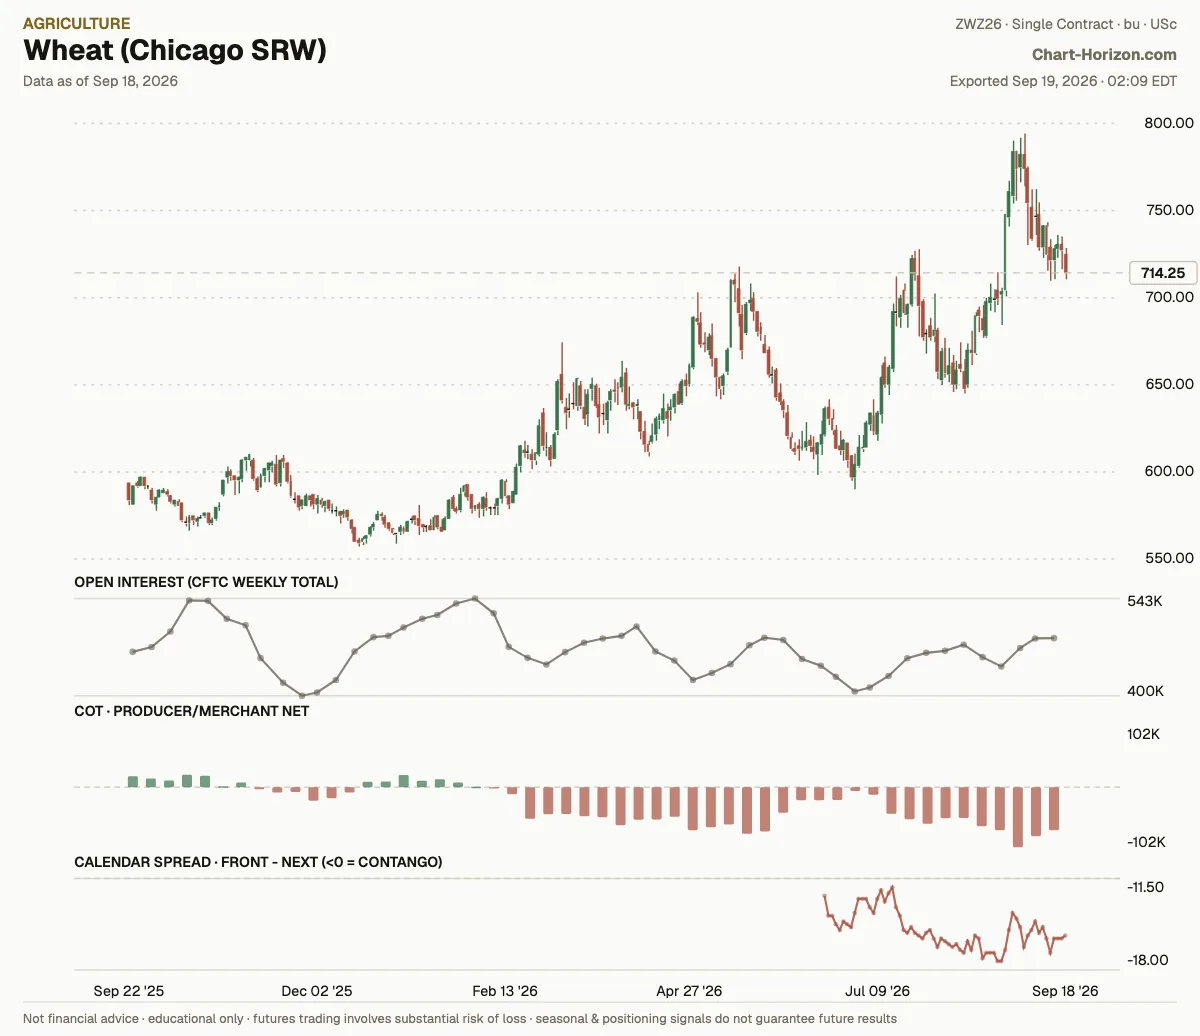
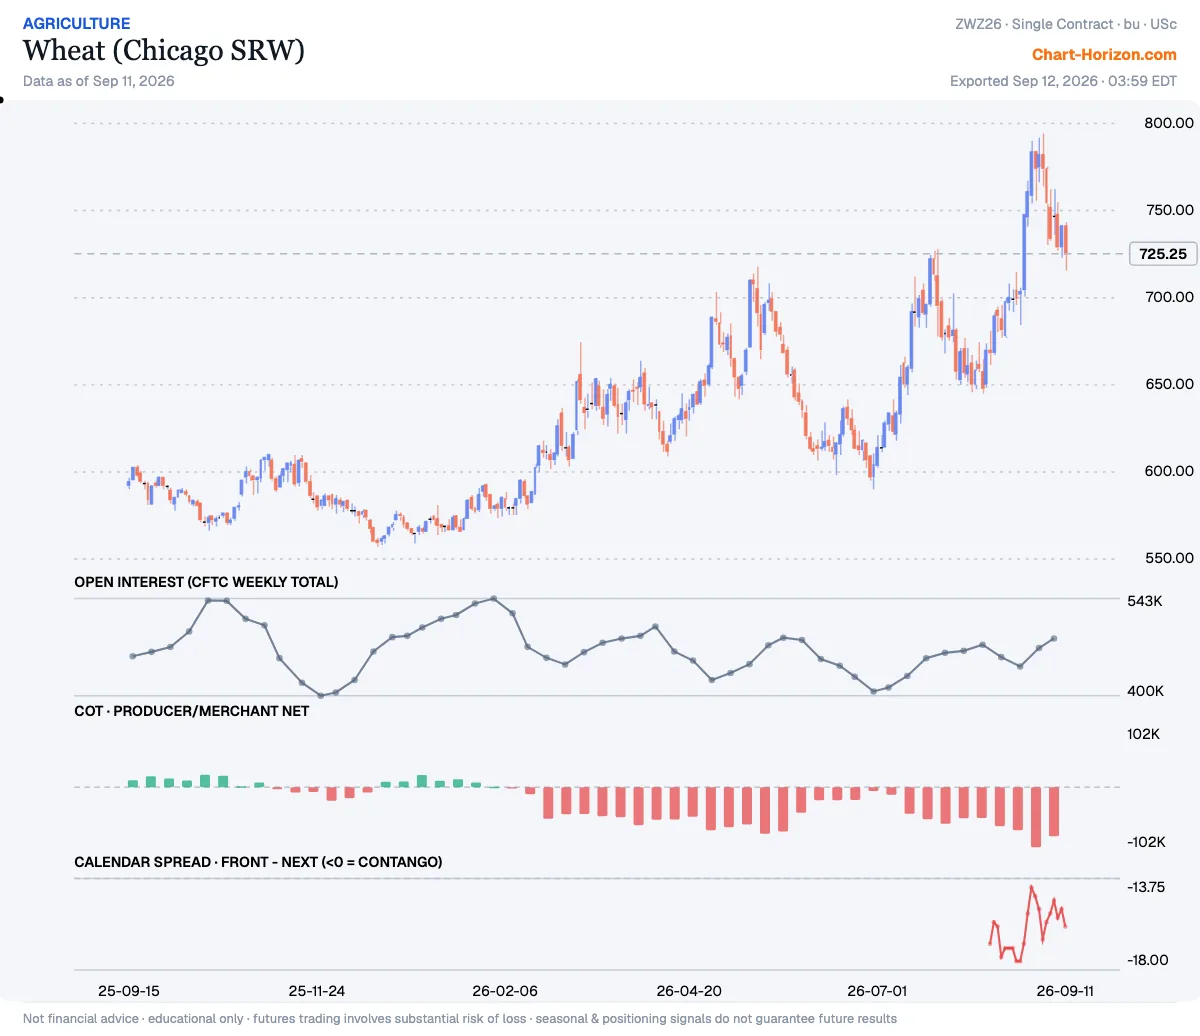
Wheat (Chicago SRW): commercials at a 3-year low
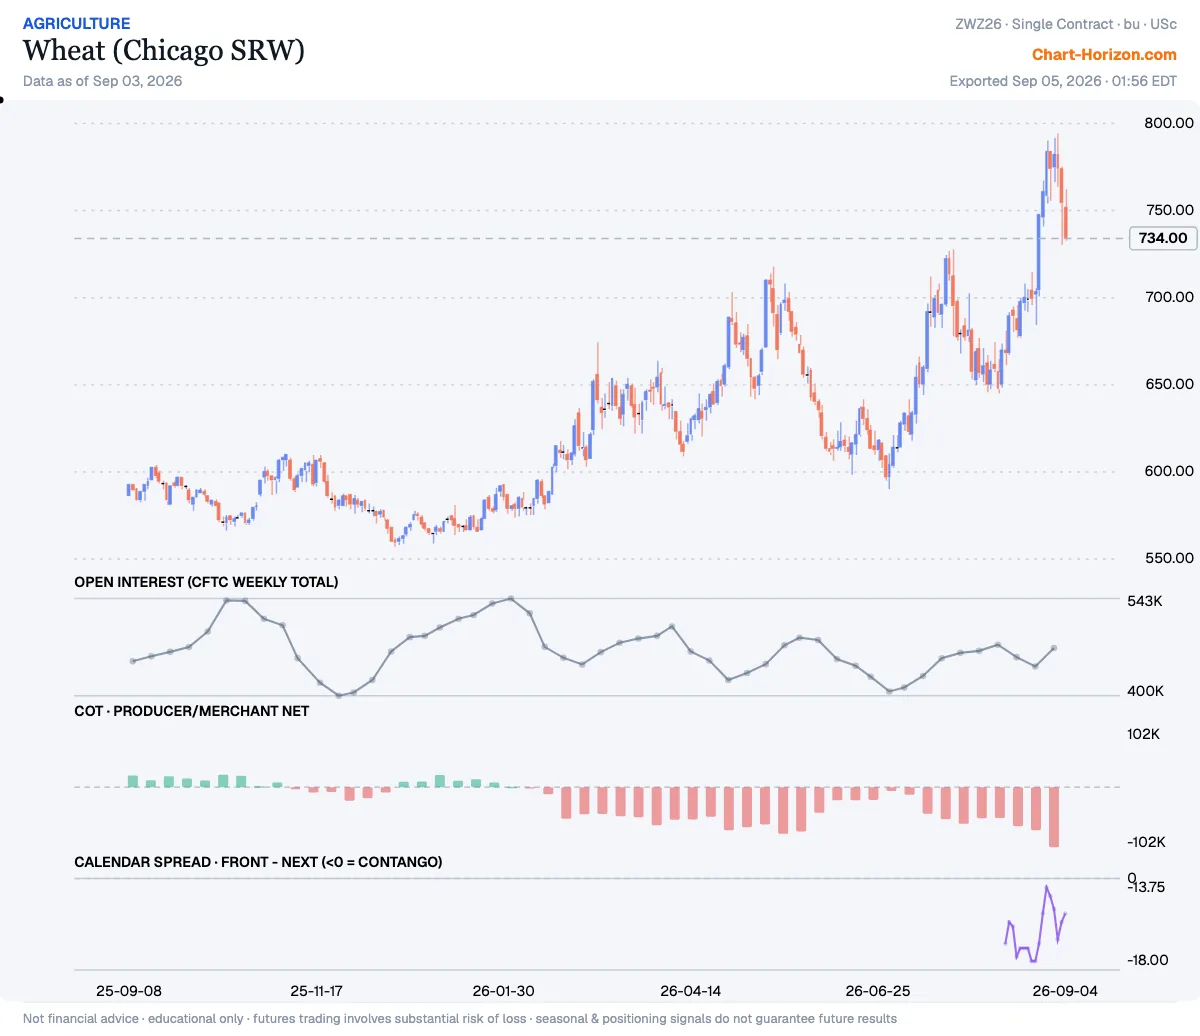
Producer/Merchant Net sits at the 3rd percentile of its ~3-year range. The commercials have been heavy net sellers. Net: -73,619 contracts (as of 2026-09-15).
30-Year U.S. T-Bond: commercials at a 3-year high
Commercial Net sits at the 97th percentile of its ~3-year range. The commercials have been heavy net buyers. Net: +141,163 contracts (as of 2026-09-15).
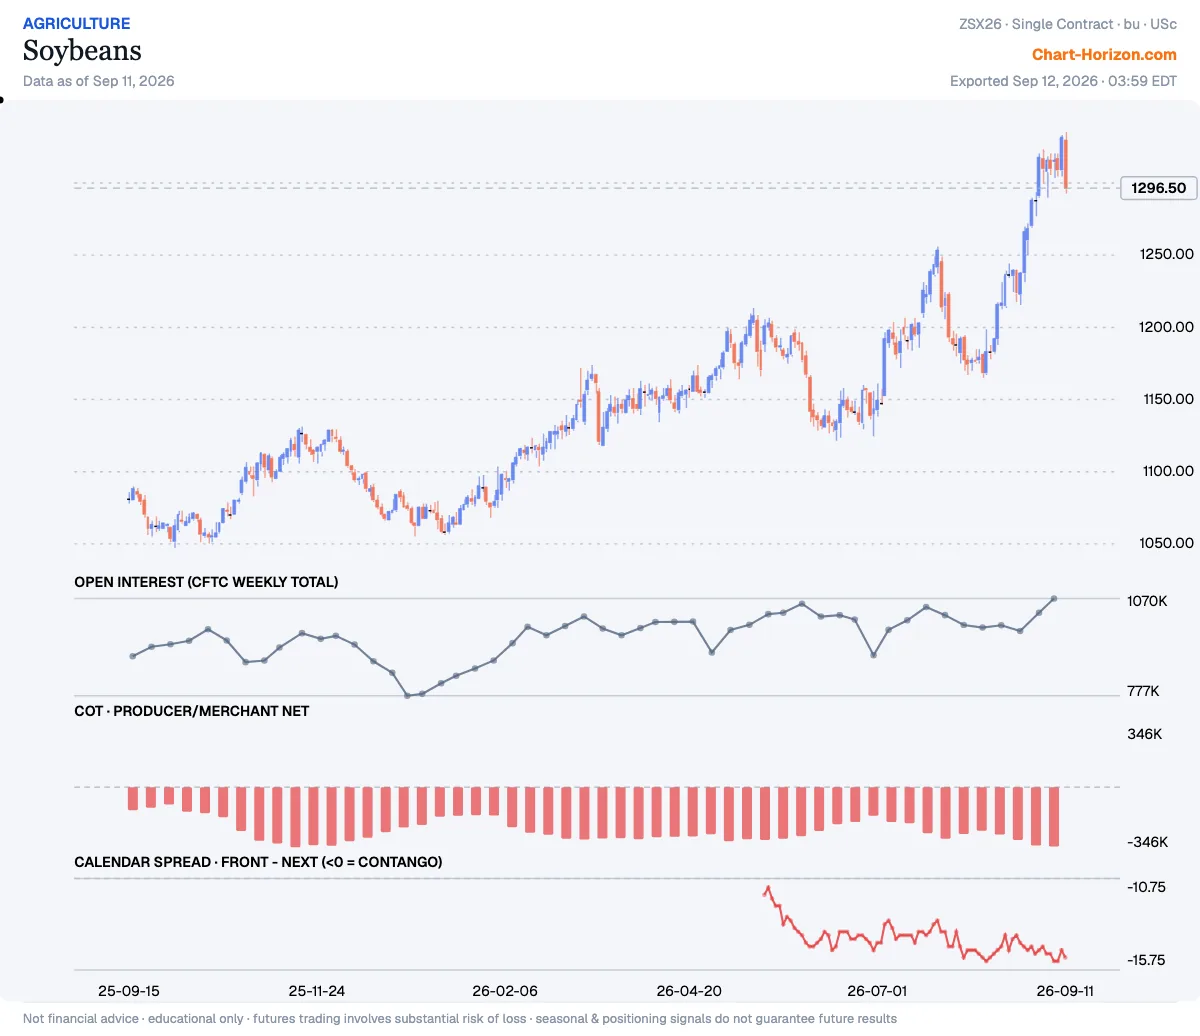
Soybeans: commercials at a 3-year low
Producer/Merchant Net sits at the 4th percentile of its ~3-year range. The commercials have been heavy net sellers. Net: -312,329 contracts (as of 2026-09-15).
The hedging program
Where each market’s tracked COT net sits inside its own trailing six-month range: above the midpoint of that range or below it. This is the same positioning read at close quarters, and it answers a different question from the extremes above: a book can sit at a three-year low and still have been working higher for six months. What follows is only what MOVED: the markets that crossed that midpoint with this week’s report.
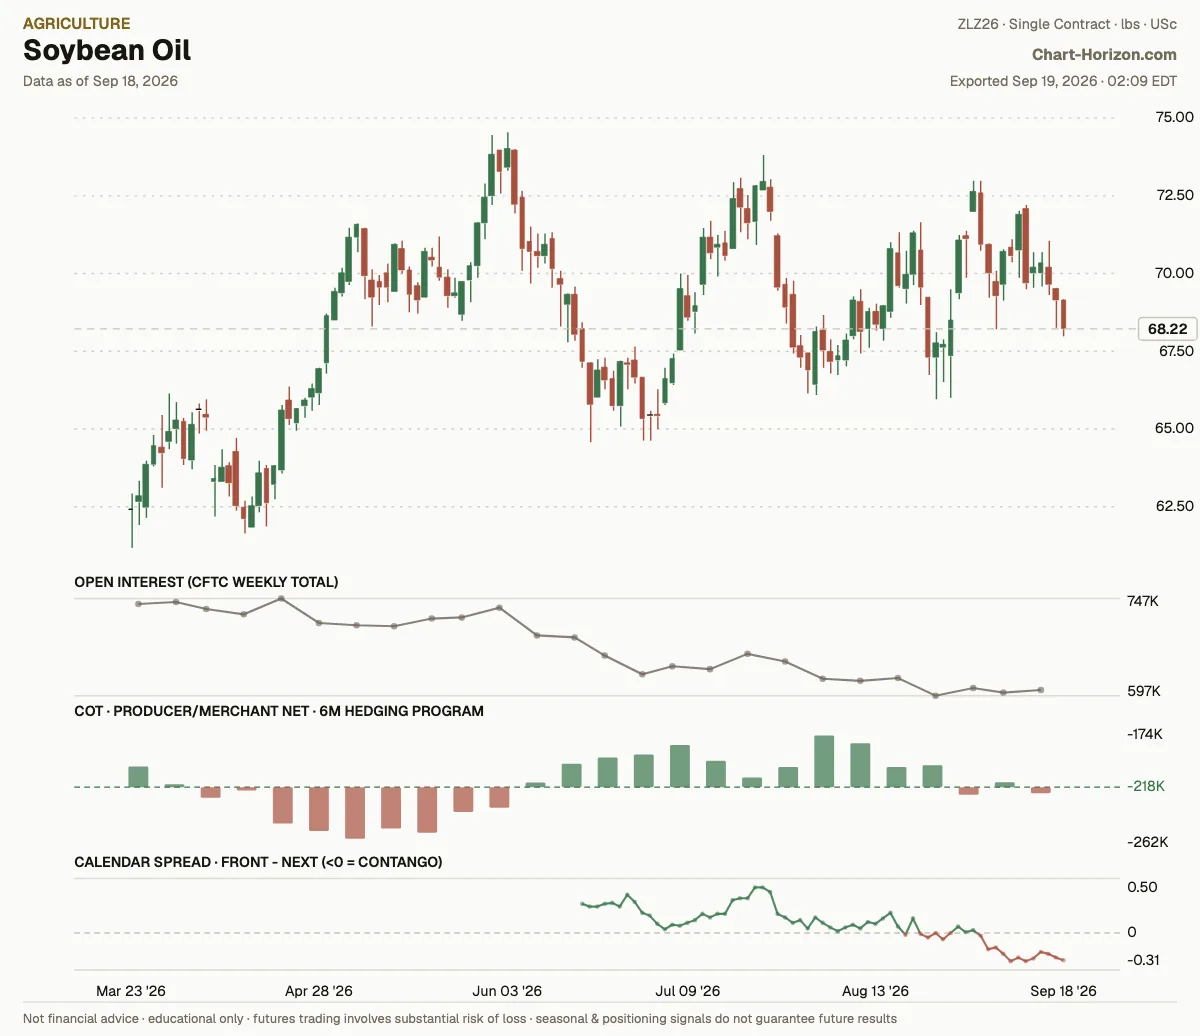
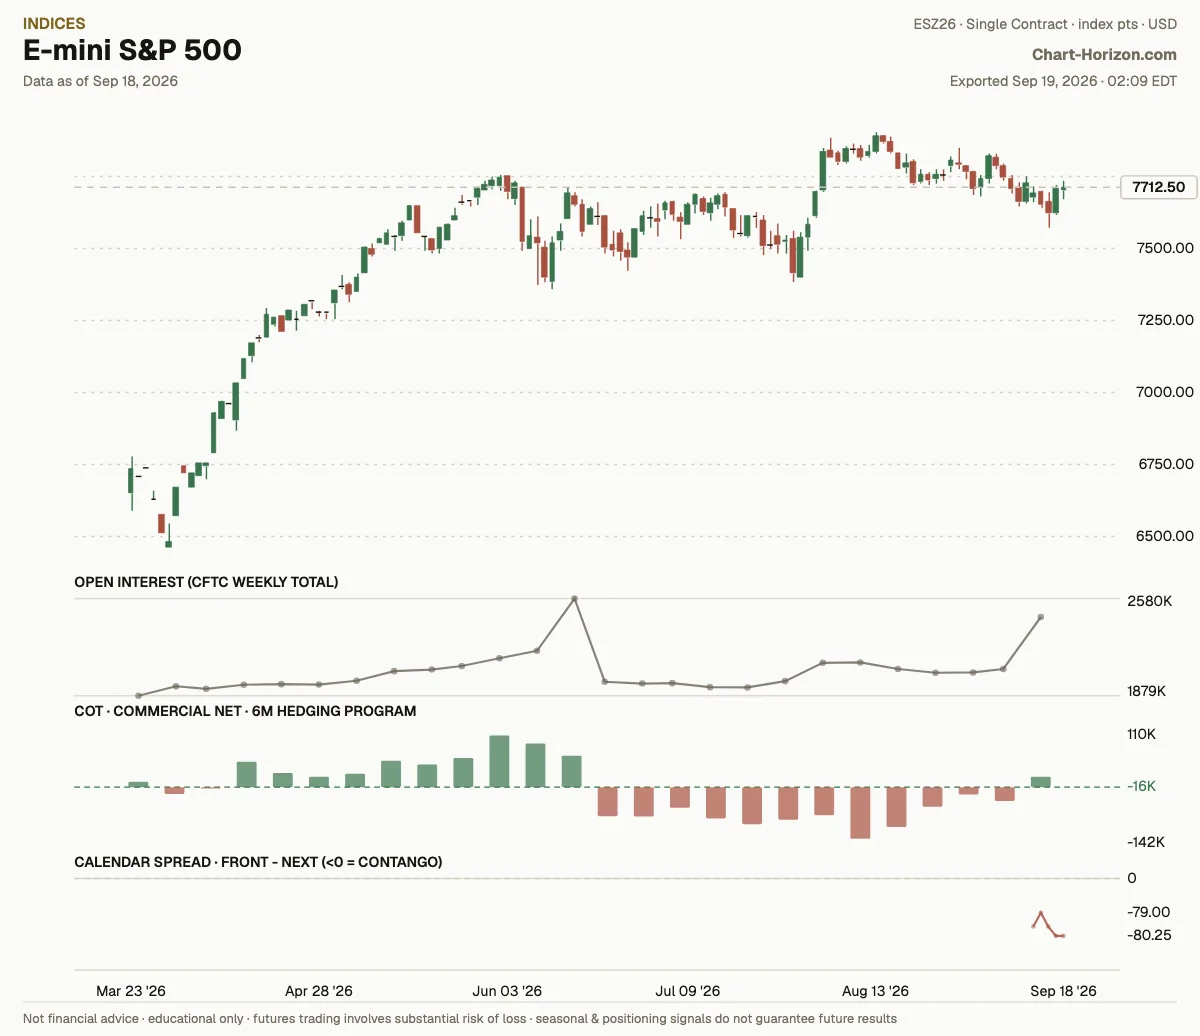
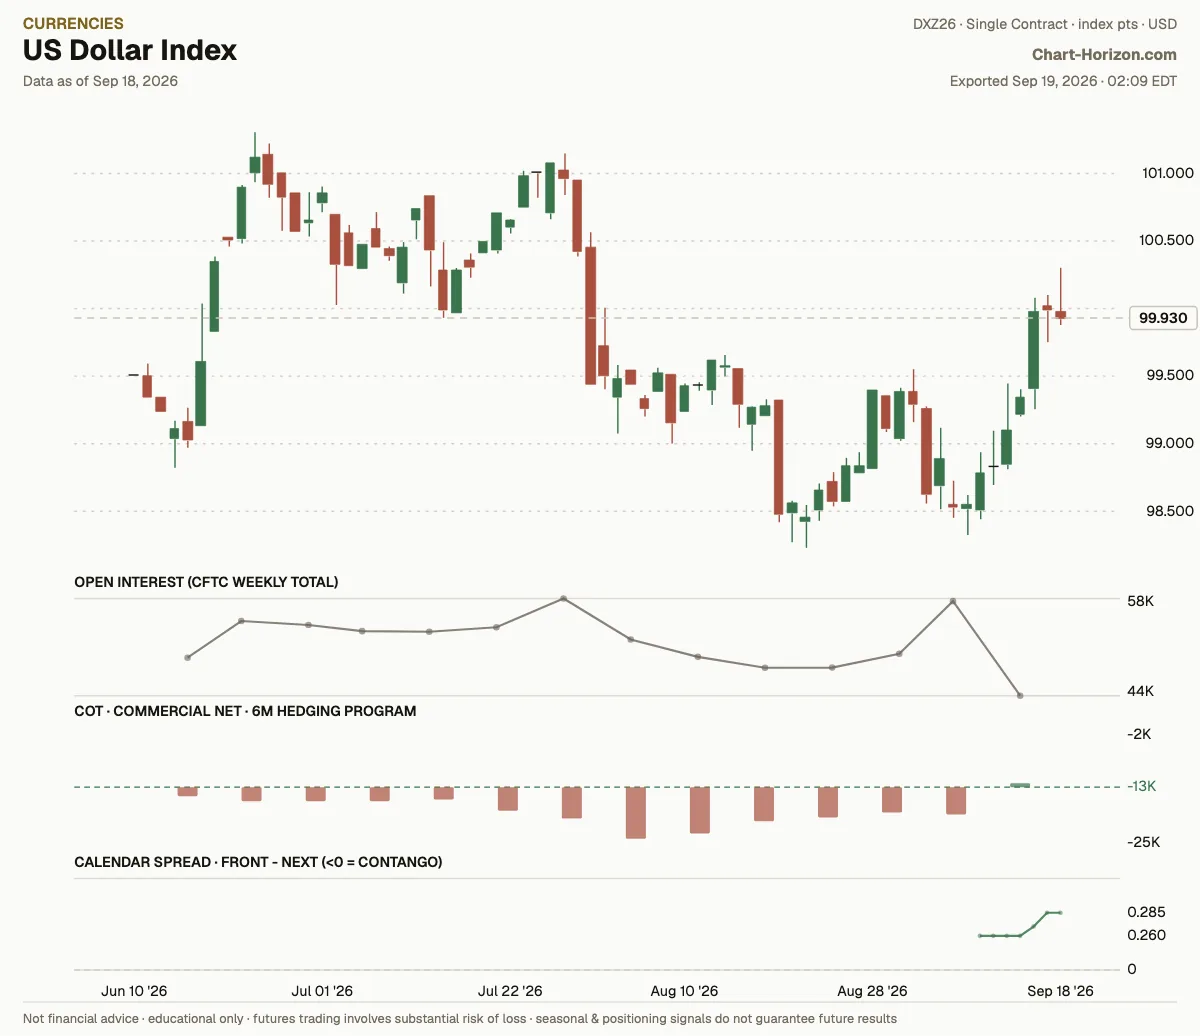
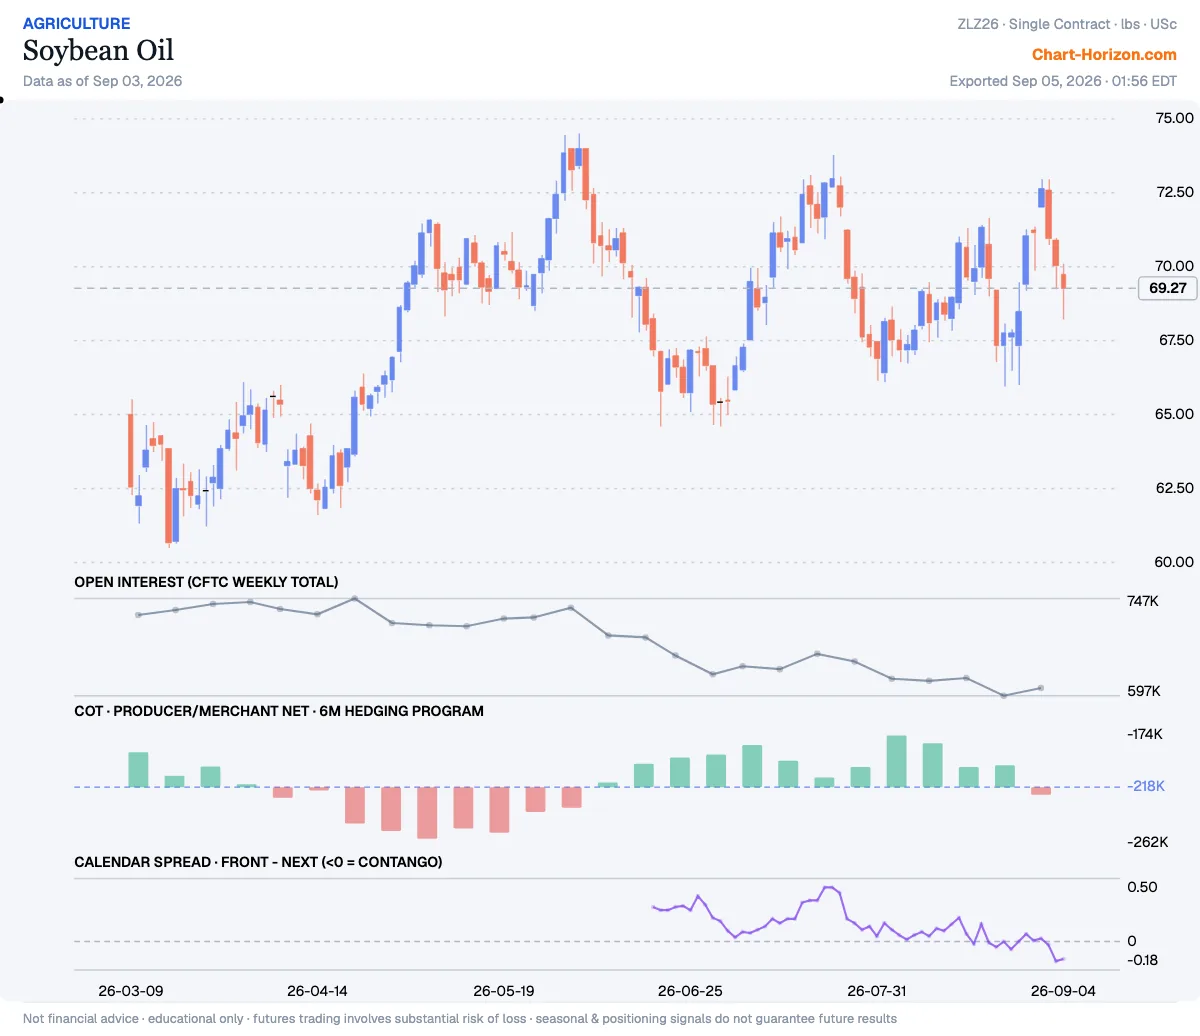
19 programs read above the midpoint of their own trailing six-month range this week, 20 below. Nine crossed it with this report: WTI Crude Oil from above to below, Natural Gas (Henry Hub) from below to above, Platinum from below to above, Soybean Oil from above to below, Coffee (Arabica) from below to above, E-mini S&P 500 from below to above, US Dollar Index from below to above, Canadian Dollar from above to below and Swiss Franc from below to above.
In the CFTC report of 2026-09-15, Producer/Merchant Net crossed the midpoint of its own trailing six-month range: it now sits below that midpoint, where the previous report still had it above. It cleared that midpoint by 11.3% of the window’s own range.
Natural Gas (Henry Hub): the program turns bullish
In the CFTC report of 2026-09-15, Producer/Merchant Net crossed the midpoint of its own trailing six-month range: it now sits above that midpoint, where the previous report still had it below. It cleared that midpoint by 11.5% of the window’s own range.
Platinum: the program turns bullish
In the CFTC report of 2026-09-15, Producer/Merchant Net crossed the midpoint of its own trailing six-month range: it now sits above that midpoint, where the previous report still had it below. It cleared that midpoint by 4.6% of the window’s own range.
Soybean Oil: the program turns bearish
In the CFTC report of 2026-09-15, Producer/Merchant Net crossed the midpoint of its own trailing six-month range: it now sits below that midpoint, where the previous report still had it above. It cleared that midpoint by 5.8% of the window’s own range.
Coffee (Arabica): the program turns bullish
In the CFTC report of 2026-09-15, Producer/Merchant Net crossed the midpoint of its own trailing six-month range: it now sits above that midpoint, where the previous report still had it below. It cleared that midpoint by 7.4% of the window’s own range.
E-mini S&P 500: the program turns bullish
In the CFTC report of 2026-09-15, Commercial Net crossed the midpoint of its own trailing six-month range: it now sits above that midpoint, where the previous report still had it below. It cleared that midpoint by 10.1% of the window’s own range.
US Dollar Index: the program turns bullish
In the CFTC report of 2026-09-15, Commercial Net crossed the midpoint of its own trailing six-month range: it now sits above that midpoint, where the previous report still had it below. It cleared that midpoint by 3.7% of the window’s own range.
Canadian Dollar: the program turns bearish
In the CFTC report of 2026-09-15, Commercial Net crossed the midpoint of its own trailing six-month range: it now sits below that midpoint, where the previous report still had it above. It cleared that midpoint by 22.8% of the window’s own range.
Swiss Franc: the program turns bullish
In the CFTC report of 2026-09-15, Commercial Net crossed the midpoint of its own trailing six-month range: it now sits above that midpoint, where the previous report still had it below. It cleared that midpoint by 5.3% of the window’s own range.
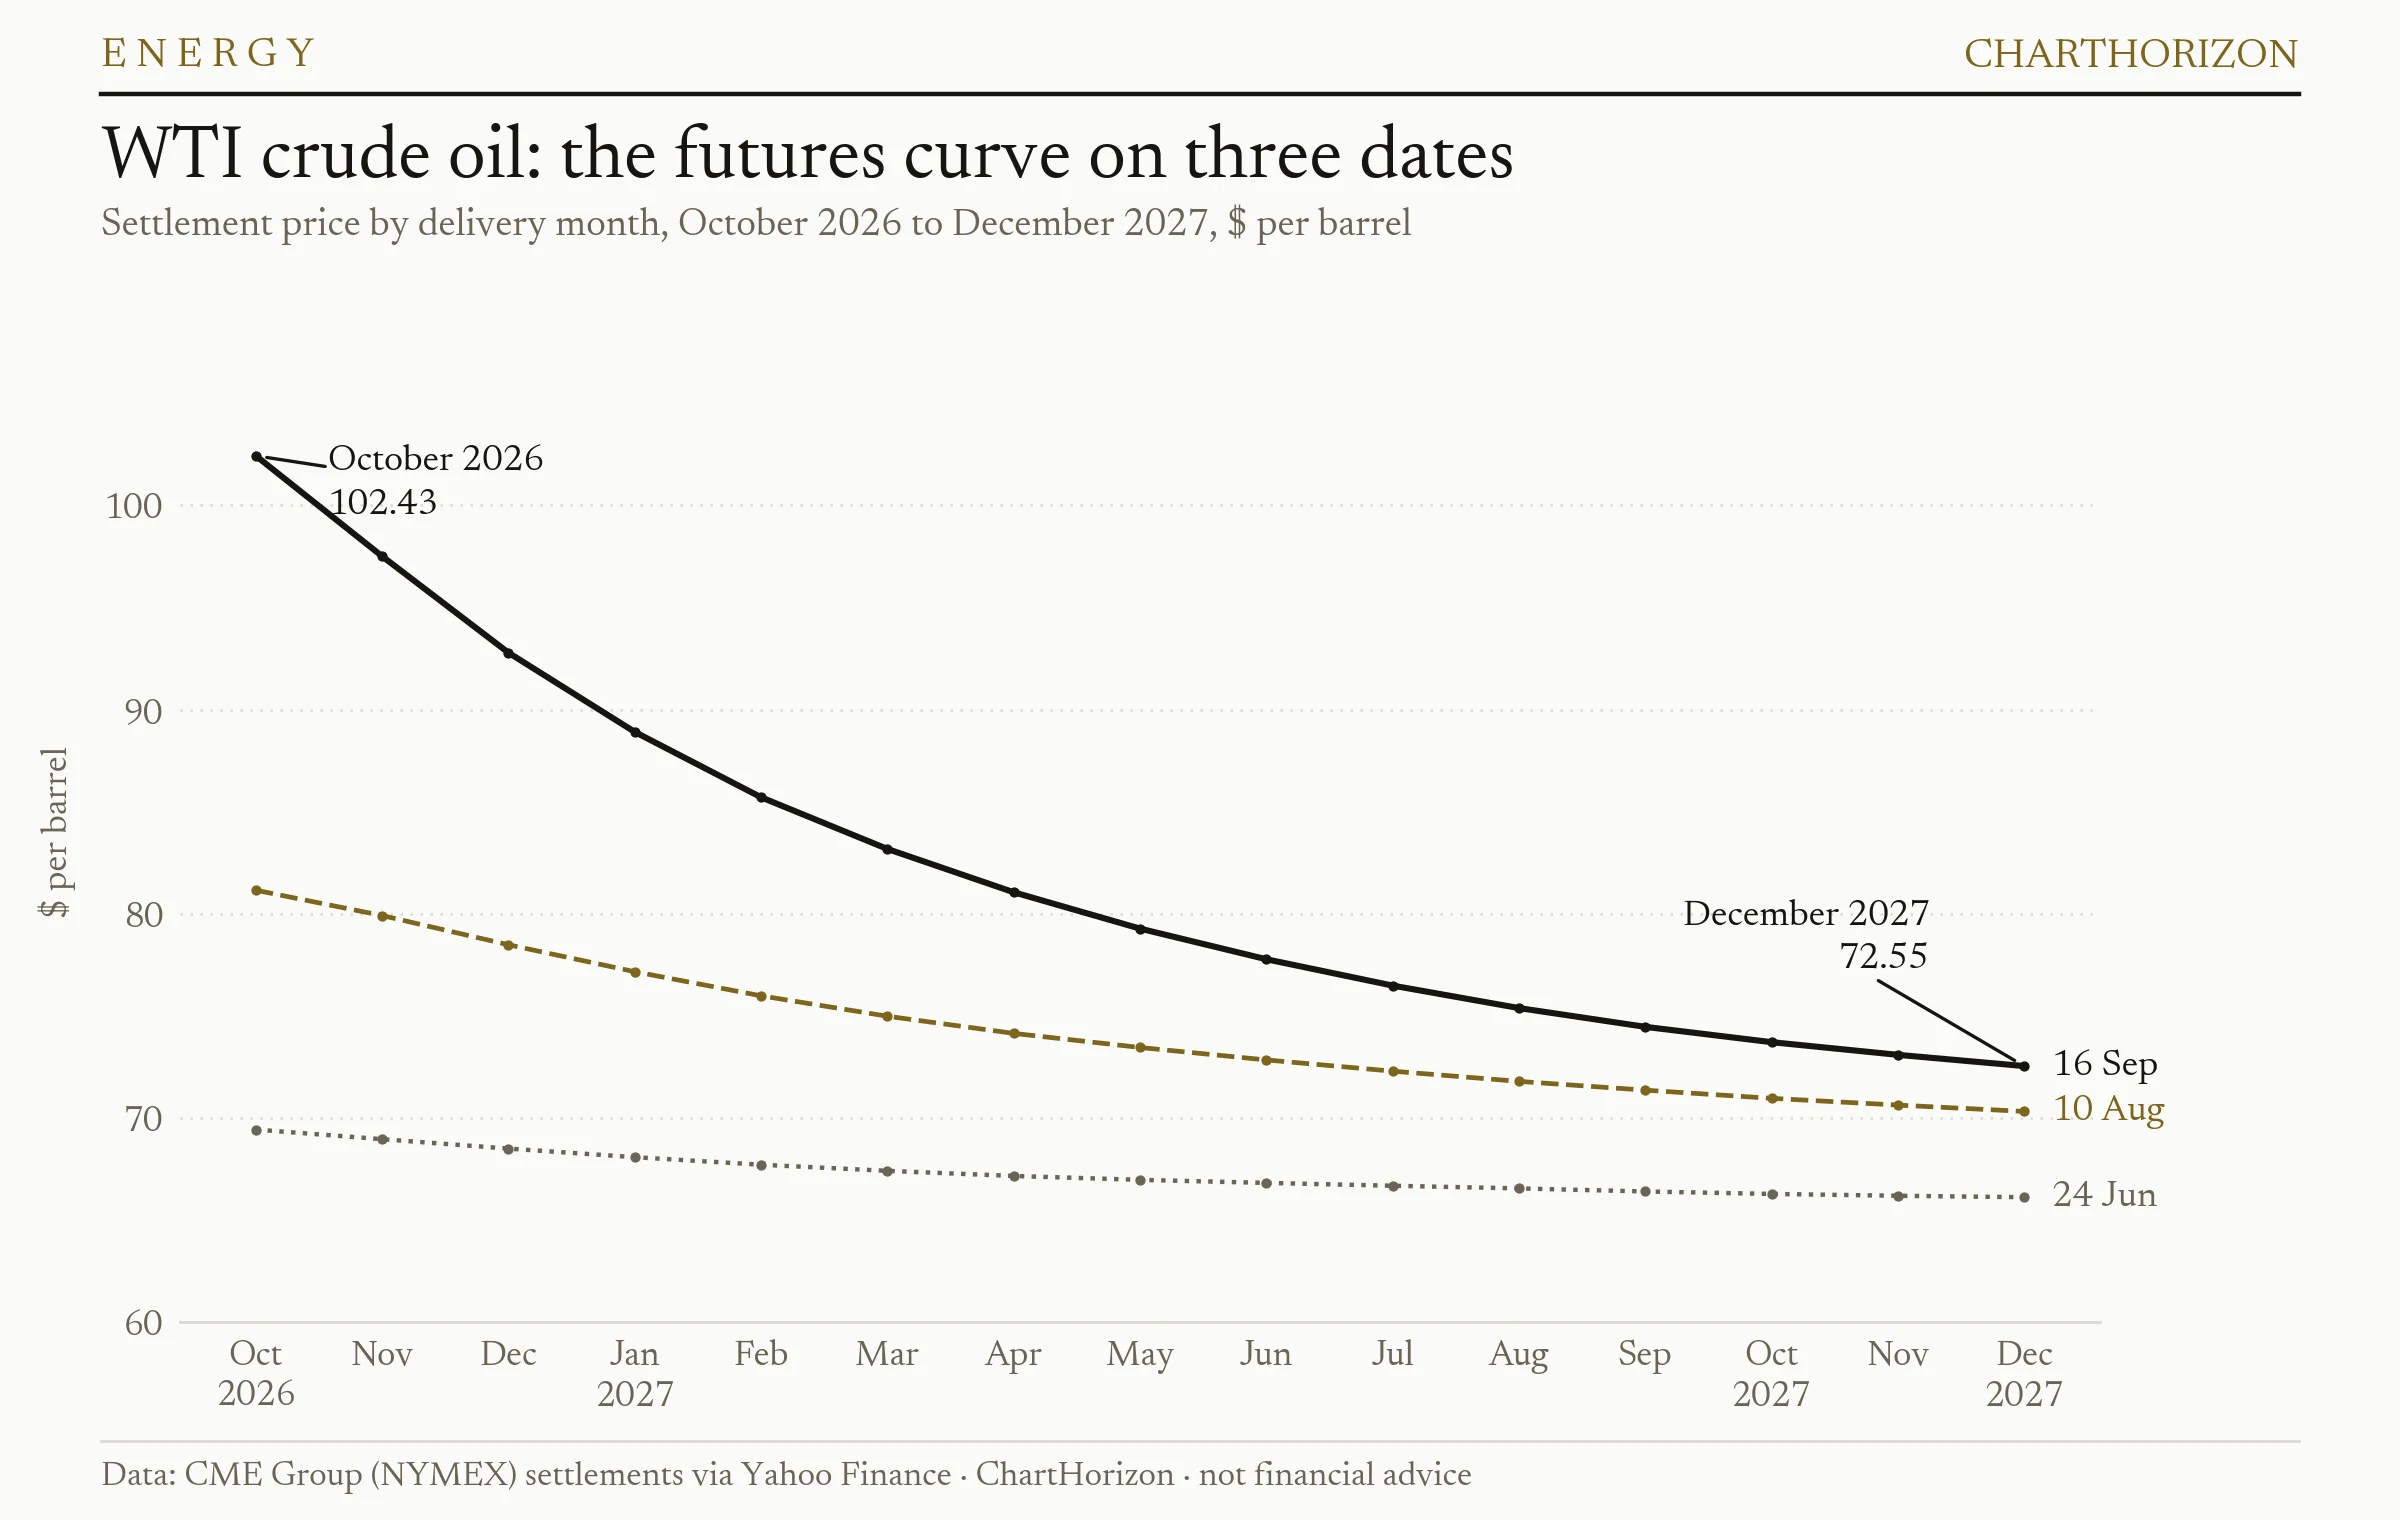
]]>ChartHorizonPriced to Pass2026-09-17T00:00:00+02:002026-09-17T00:00:00+02:00https://chart-horizon.com/2026/09/17/priced-to-passOn Wednesday afternoon the Federal Reserve raised its policy rate for the first time since July
2023, by a quarter point to 3.75–4 per cent, on a unanimous vote. That day the October WTI crude
contract settled at $102.43 a barrel. The December 2027 contract settled at $72.55.
Those two prices are this note. The first is what oil costs now, in a war that has cut most of the
traffic through the Strait of Hormuz and, since last Friday, the Saudi pipeline that goes around it.
The second is what the same barrel costs for delivery fourteen months later, and it is almost thirty
dollars cheaper. The Fed acted in a week dominated by the first. The futures market has already
priced the second.
That is less of a disagreement than it looks, and the reason is the useful part.
The week the pipeline closed
The shortage is real. On 8 September the US military said it had destroyed five Iranian tankers
near Jask and Kharg Island after missile attacks on a Navy warship. Iran fired ballistic missiles
toward US targets in Jordan, whose military said it intercepted 18 of them. On 10 and 11 September
drones launched from Iraqi territory hit pumping stations on Saudi Arabia’s East-West pipeline, the
1,200-kilometre line that carries about five million barrels a day from the eastern fields to the
Red Sea port of Yanbu. It is the kingdom’s way around Hormuz, and Riyadh shut it on the 11th as a
precaution.
Rystad Energy put the loss at three to five million barrels a day of exports and priced the problem
by how long it lasts. One month means 78 to 120 million barrels, which inventories and deferred
cargoes can cover. Three months means 230 to 360 million, which, Rystad said, “cannot be replaced
solely through spot market reallocation”. On Wednesday Saudi Aramco was reported to be working
around the damaged section, aiming to restore about half the capacity within days and all of it in
roughly six weeks. The same morning the Energy Information Administration reported a crude draw of
640,000 barrels.
The October contract went from $96.05 on 9 September to $102.48 on the 10th, touched $106.75 on
Tuesday, and gave back 3.2 per cent on Wednesday. On 10 August it had stood at $81.16. Retail diesel
set a record of $6.06 a gallon on 11 September.
What the Fed said, and what it left out
The statement never mentions oil. It says uncertainty “remains elevated owing, in part, to
geopolitical developments”, that “inflation remains elevated”, and that the increase “will support
a timelier return to the Committee’s 2 percent goal”. Chairman Warsh was more specific in his
opening remarks. He recalled saying at Jackson Hole that commodity prices “bear watching”, noted
that “the prices of many of these key inputs have risen” since July, and set out what the Committee
means to ensure: “that relative price changes in some sectors of the economy do not broaden, that
inflation compensation in market prices stays low, and that inflation expectations remain
well-anchored.”
Nothing on that list is the price of oil. A central bank cannot pump a barrel. What it can do is
stop a rise in one price from becoming a rise in all of them, and keep the market’s long-run price
of inflation where it is, and Warsh named that market price as a yardstick.
The projections published alongside put total PCE inflation at 3.7 per cent this year and 2.3 per
cent next, with the median funds rate at 4.1 per cent at the end of this year and unchanged through
next. Sixteen of eighteen participants expect at least one more increase. The Fed’s own forecast,
in other words, has the shock passing too. It raised rates anyway, as insurance on that forecast.
What the curve is pricing
WTI crude oil futures · settlement by delivery month, October 2026 to December 2027 · 24 June, 10 August, 16 September · CME Group via Yahoo Finance · ChartHorizon
On 24 June, with the front contract near its low for the summer, the whole strip from October 2026 to
December 2027 sat within $3.31: $69.44 at the front, $66.13 at the back. On 10 August the gap was
$10.83. On Wednesday it was $29.88.
Since 10 August the October contract has gained $21.27, or 26 per cent. March 2027 has gained
$8.19. December 2027 has gained $2.22, or 3 per cent. Nearly all of the rally sits in barrels that
can be delivered before the year is out, and the further along the curve you look, the less of it
there is.
A futures curve is not a forecast, and this one should not be read as a promise. It is a row of
prices at which barrels for different months change hands today. A curve this steep mostly says that
a barrel in the tank now is worth far more than a barrel next year, which is what a market says when
it is drawing down inventories to cover a hole. But the back of the curve is also the price at which
a producer can sell next year’s oil today, and at which a refiner or an airline can buy it. On
Wednesday the twelve contracts of calendar 2027 averaged $78.47. Nobody with 2027 barrels to
sell or to buy was being offered $100.
The desk’s term-structure light shows the same thing one step along the curve. The spread between
the December and January contracts widened from $1.50 on 12 August to $4.49 on Tuesday, and was
$3.88 on Wednesday.
The bond market’s version
Warsh’s “inflation compensation in market prices” has a public series. The five-year, five-year
forward inflation expectation rate, which the St. Louis Fed derives from Treasury yields, measures
what the bond market charges for inflation between five and ten years from now.
It stood at 2.33 per cent on 10 August and at 2.31 on Wednesday. Across the whole of this rally in
oil, it barely moved. The five-year breakeven, which covers the nearer years and so takes in the
shock itself, rose from 2.25 per cent to as high as 2.46 on 10 September, and was 2.35 after the
hike. The bond market expects more inflation for a while and no more than before in the long run,
which is the curve’s reading in another market.
There is a caveat, and it is the best argument the Fed has. The same forward rate stood at 2.05 per
cent on 30 March, when the front WTI contract settled at $102.88. On Tuesday it reached 2.35, its
highest this year. It barely moved with this month’s oil, but it has risen thirty basis points since
the spring, with oil at about the same price at both ends. That drift is exactly what “inflation
expectations remain well-anchored” is about, and it is a better reason for Wednesday’s hike than the
price of a barrel. The hike’s first day took four basis points off it.
Who sold forward
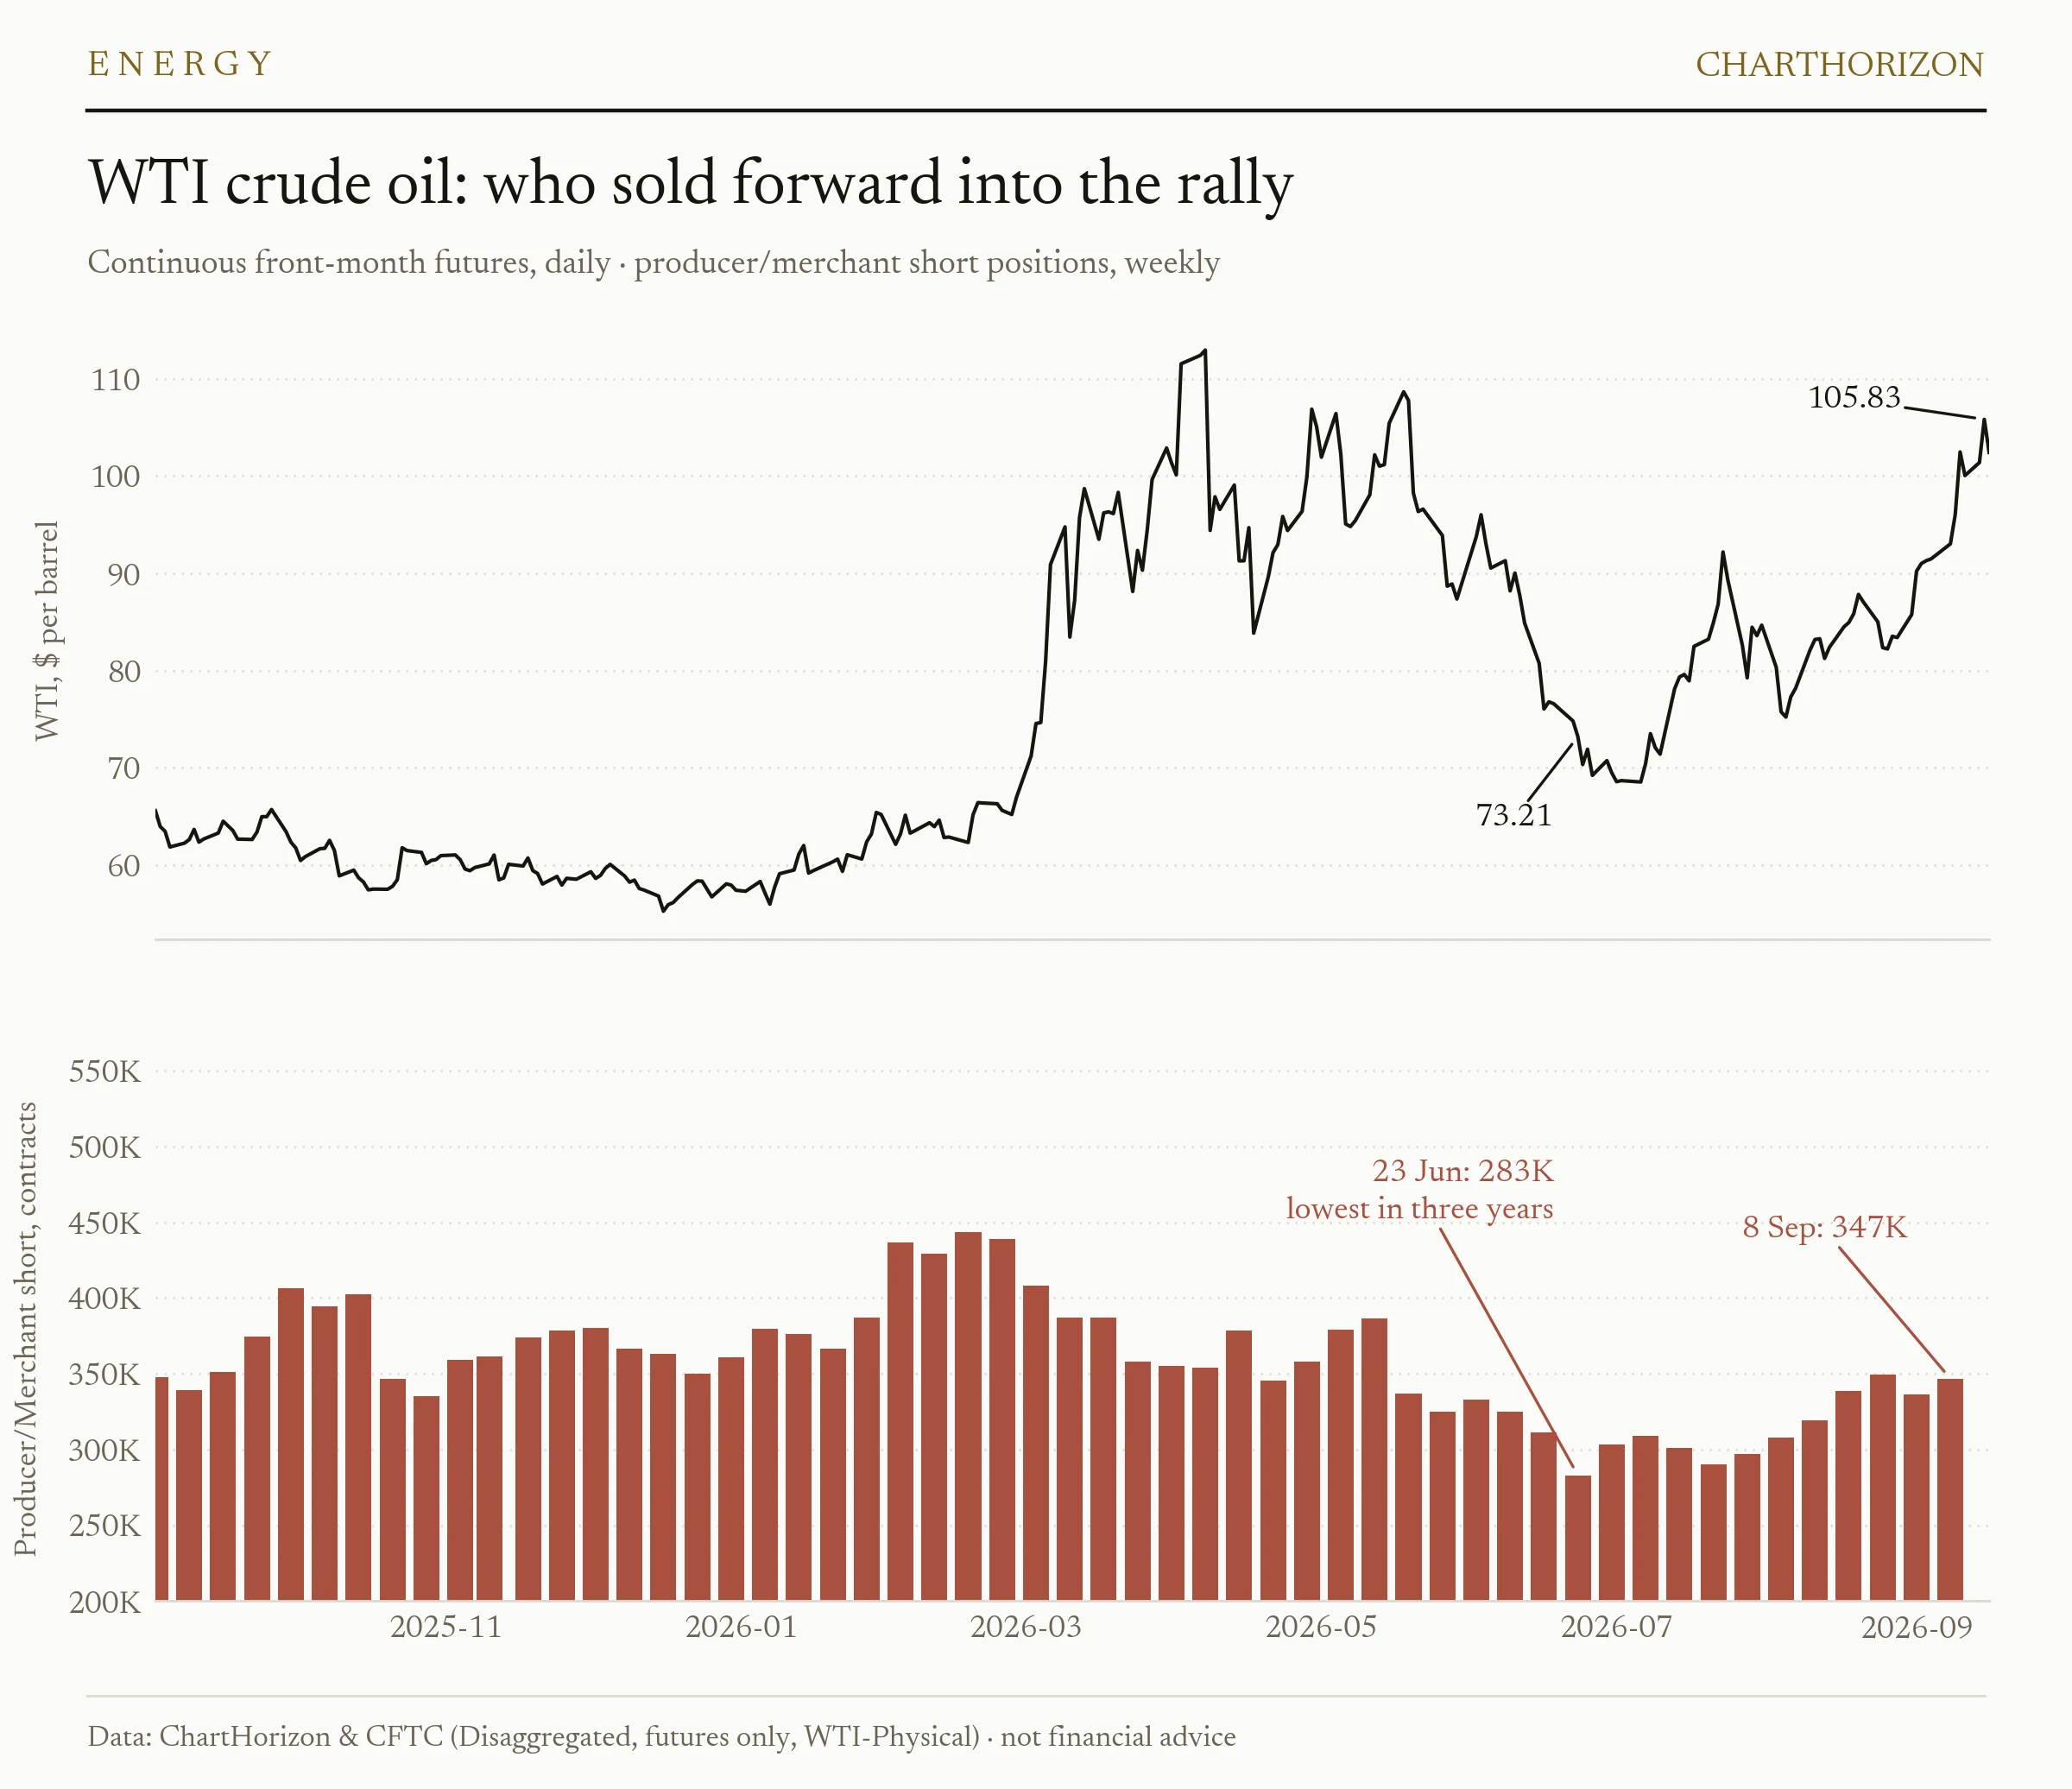
WTI crude oil · continuous front-month futures, daily · producer/merchant short positions, weekly, one year · CFTC Disaggregated report, futures only · ChartHorizon
If the back of the curve is the price producers can lock in, the commitments report shows whether
they took it. In WTI they did, without hurrying.
The producer/merchant short book, which holds the hedges of the firms that pump, store and ship the
oil, stood at 283,032 contracts on 23 June. That was its smallest in the three years of the desk’s
archive, with the front contract at $73. In the report dated 8 September it had grown to
346,775, an increase of 63,743. That is still only the 26th percentile of three years; in May
2024 the same book held 472,761. The long side of the same group fell from 700,107 contracts in
mid-July to 655,691, and the net position, a three-year high of 399,298 contracts long on 14 July,
is down to 308,916.
So the producers sold into the rally, as producers do, and the prices they sold at are the ones on
the right of the curve chart, not the left. They sold less than they have in other years. The report
records how much they sold, not why they held back.
Mind the timing. The report is dated Tuesday 8 September, before the pipeline was hit and before
the October contract settled above $100 on the 10th. The report dated 15 September, published on
Friday, is the first to show what the hedgers did at $100.
In gasoline, where the hedgers are the refiners, the selling was heavier. Their net short reached
102,029 contracts, the deepest since 3 March and the 8th percentile of three years.
Before this week
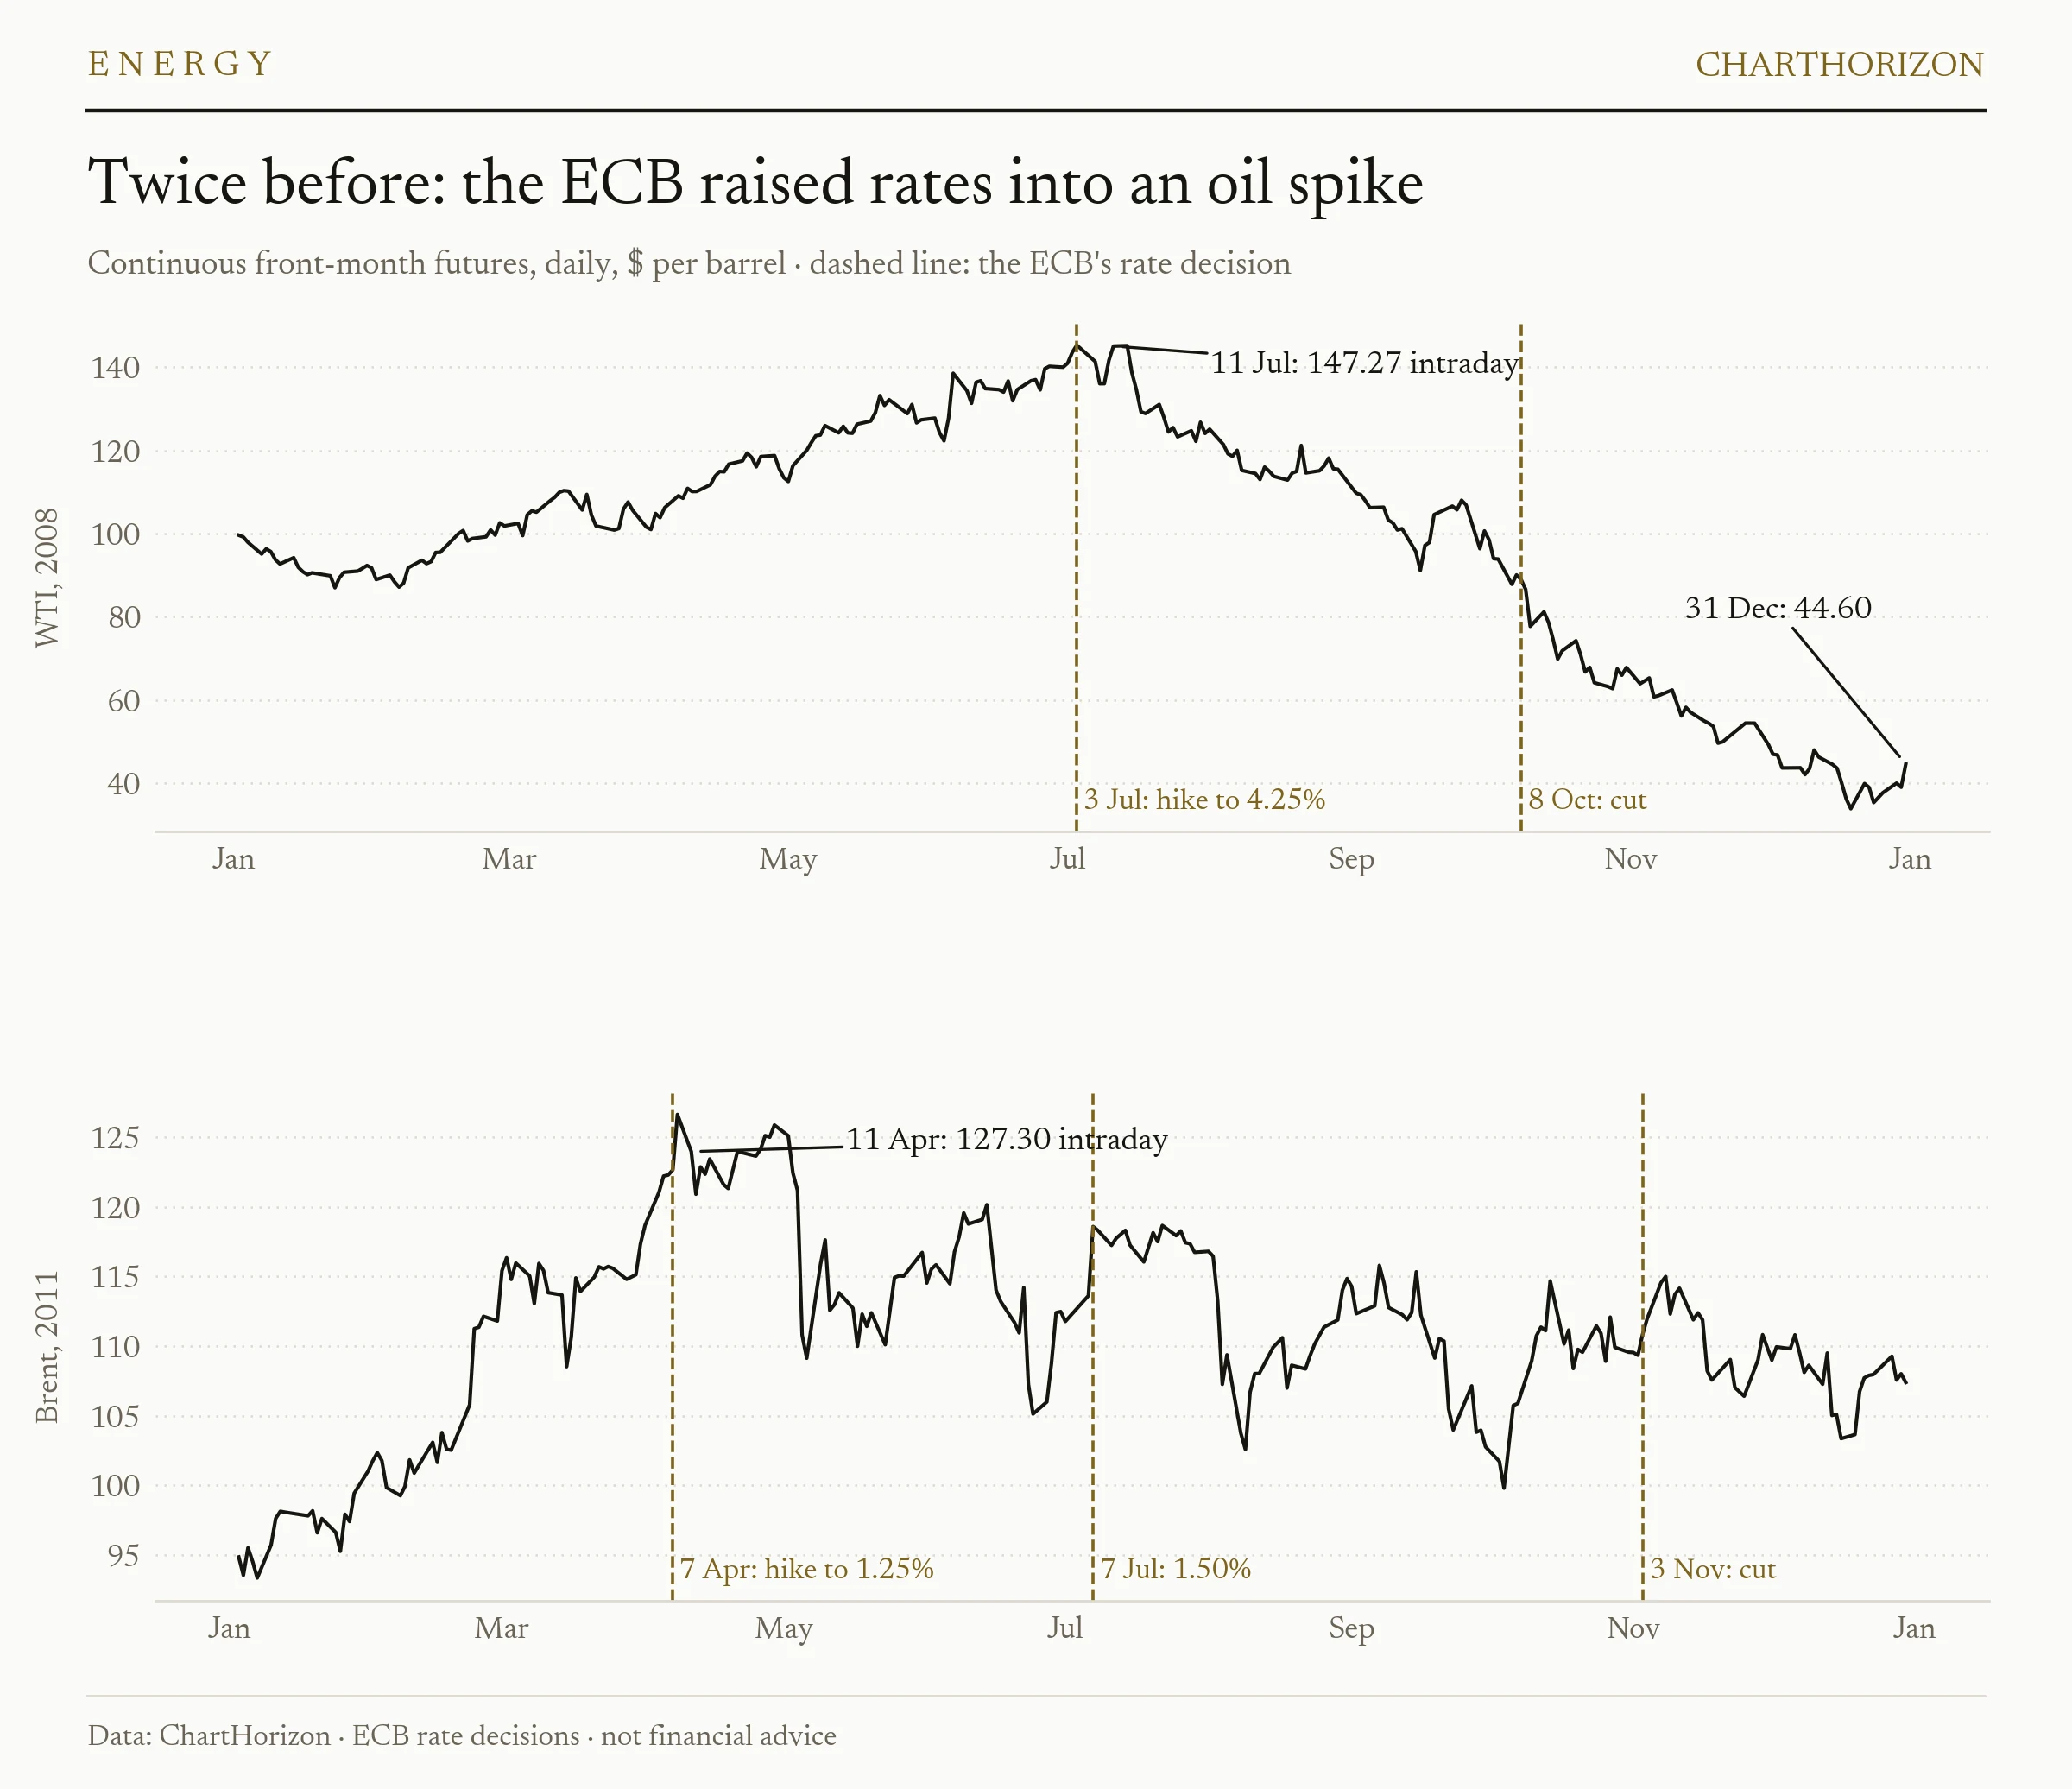
WTI crude oil, 2008, and Brent crude oil, 2011 · continuous front-month futures, daily · with the European Central Bank's rate decisions · ChartHorizon
Central banks have raised rates into oil spikes before, and the desk’s price archive holds three
such cases, two from the European Central Bank and one from the Fed.
On 3 July 2008 the ECB raised its main rate to 4.25 per cent, with WTI at $145.29. Eight days later,
on 11 July, WTI traded at $147.27, which is still the record. It ended the year at $44.60, and the
ECB was cutting by 8 October.
On 7 April 2011 the ECB raised its rate to 1.25 per cent, pointing to energy and commodity prices,
with Brent at $122.67. The next day Brent settled at $126.65, its highest close of the year, and on
11 April it traded above $127. The ECB raised again in July, and in November it began taking both
increases back.
The Fed’s own case is March 2022, and it fits less neatly. The Fed raised rates on 16 March, its
first increase since 2018, with WTI at $95.04, nine days after the front contract had traded $130.50
in the wake of Russia’s invasion of Ukraine. The spike had topped, but the shock had not passed: WTI settled at
$122.11 on 8 June, and by the time it ended the year at $80.26 the Fed had raised rates six more
times.
Three episodes prove nothing. This desk once tested a seasonal claim across
5,026 market-months before it would print a conclusion,
and three cases come nowhere near that. They make a narrower point. A central bank that responds to
a price spike responds to a price that is already there. Twice the spike was within days of its
top; the third time it had topped nine days earlier and came back three months later. This year
has its own example without any central bank in it: WTI settled at $112.95 on 7 April and at $83.85
on 17 April, the day Iran declared the strait open, and traded below $70 on 24 June.
What last week got wrong
Last Saturday’s note, Failure to Confirm, set five tests for a
turn in the summer’s trade and promised to report back. Three have failed, one is holding, and one
has not happened.
The ten-year yield stays under 4.98 per cent. Failed. It closed at 5.00 on Tuesday and 5.01
on Wednesday, above its October 2023 peak.
November soybeans stay under 1335¼. Holding. The contract reached 1332¼ on Wednesday.
The dollar index cannot make a higher high once the Bank of Japan has delivered. Failed
before the Bank of Japan had even met: the December contract traded 100.085 on Wednesday,
through 99.555.
The Nasdaq 100 holds its 2 September low through Wednesday. Failed on Monday, when the
September contract traded 28,816¼, under 28,927¼.
Oil follows the grains, with Brent back under $100. Not met. November Brent’s lowest trade
this week was $104.06, on Wednesday.
Within three sessions the divergences resolved in the direction of the trend. The plain reading is
that the note mistook a pause for a refusal. Its closing point does stand: the one market that had
not joined the turn was oil, and oil is the market the Fed has now answered.
What would change this read
Four things, each with a number attached.
The back of the curve stays put. December 2027 WTI is $72.55. If it climbs through $80 while
the front holds, the market has started pricing a longer shock, and the insurance the Fed bought
on Wednesday becomes the main policy.
The long-run inflation rate stays below its high. The five-year, five-year forward was 2.35
per cent on Tuesday. A close clearly above that says the hike did not buy what it was meant to.
The spread narrows when the pipeline returns. Aramco expects half the capacity back within
days. If the pipeline runs again and the December-January spread does not fall back toward the
$1.50 it showed in August, the shortage is not the pipeline’s.
The hedgers sell at $100. If the report dated 15 September shows the producer short book well
above 346,775 contracts, producers treated the rally as a price to lock in, which is the most
direct statement a market participant can make about how long it expects a price to last.
One practical note. The October WTI contract expires on 22 September. On continuous charts,
including the price panel of the second chart above, the series then switches to November, which settled $4.92 lower on
Wednesday. That will look like a fall on the day. It will not be one.
The read
Oil at $100 is a fact about this autumn. The curve, the Fed’s own projections and the bond market’s
long-run inflation rate all say, each in its own way, that it is not yet a fact about 2027.
Wednesday’s hike was meant to keep it that way, and Warsh said which market price he will be judged
by.
The risk to that sits at the back of the curve, not the front. A front-month contract can lose $29
in eight sessions, as the front contract did in April, and the case for the hike would weaken
with it. A December 2027 contract that starts to follow the front would be the market’s way of
saying the shock has stopped being temporary, and every reading in this note would change with it.
]]>ChartHorizonFailure to Confirm2026-09-12T00:00:00+02:002026-09-12T00:00:00+02:00https://chart-horizon.com/2026/09/12/failure-to-confirmThe oldest rule in Dow Theory is also its simplest. When one member of a family makes a new extreme
and its siblings decline to follow, the move is unconfirmed — and an unconfirmed move is where
trends tend to run out of road.
This week four families disagreed with themselves at once. The thirty-year bond made a new low that
the ten-year and the two-year refused. Soybeans made a new high that corn and wheat refused. The
euro and the pound made new lows that the dollar index refused. The S&P 500 and the Dow made new
lows that the Nasdaq 100 refused.
One at a time, each of those is a detail. Together they lean the same way, and it is the opposite
of the way every headline leaned this week. What follows is the four charts, what is actually
inside each of them — in two cases rather less than the picture suggests — and the one market that
has not disagreed with anything.
The case the news made
On the news, the week closed the case for the summer’s trade. August consumer prices rose 0.4 per
cent on the month and 3.4 per cent on the year; core prices rose 0.3, a tenth more than forecast;
and the energy index now stands 16.3 per cent above a year ago. CME’s FedWatch tool moved to odds of
nearly nine in ten on a quarter-point hike this Wednesday. On Thursday the European Central Bank
raised its deposit rate to 2.50 per cent, its second increase since the war with Iran began, and all
52 of the Bank of Japan watchers surveyed by Bloomberg expect a hike to 1.25 per cent on the 18th.
Brent touched about $108 on Thursday. Oil has risen more than eighteen per cent in September alone.
And on Thursday the thirty-year Treasury yield closed at 5.37 per cent — above the 5.35 it
reached in June 2007, on the Treasury’s own daily curve.
Inflation rising, central banks hiking, long yields through a pre-crisis peak. Every one of the
charts below was drawn in that same week.
The long end signed alone
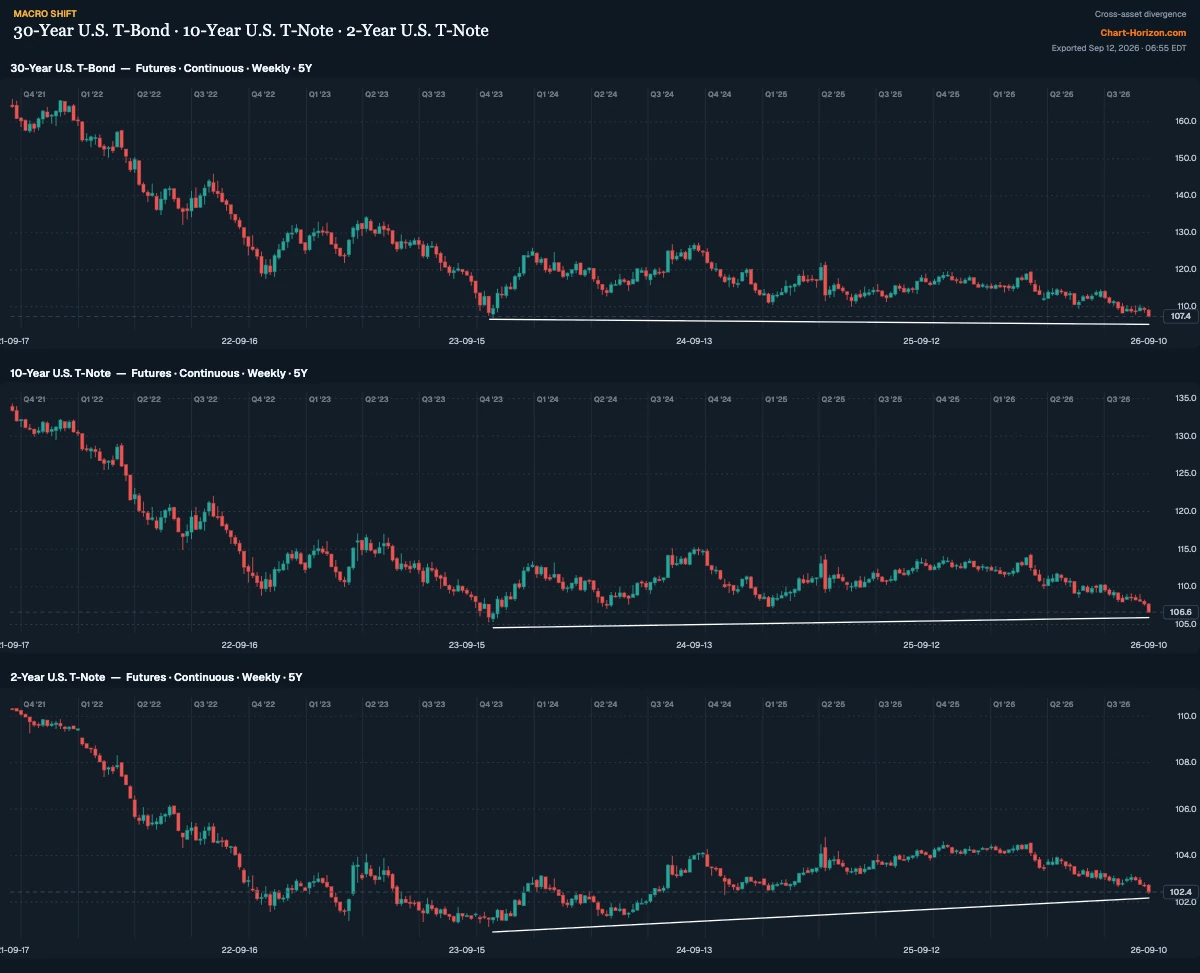
30-Year T-Bond · 10-Year T-Note · 2-Year T-Note · futures, continuous, weekly, five years · ChartHorizon
Measured in yield — the cleaner comparison across three years of contract rolls — the break sits on
one line only. The thirty-year closed Friday at 5.35 per cent, 24 basis points above its October
2023 peak of 5.11. The ten-year closed at 4.96, its highest since that October and still two
basis points short of the 4.98 it set then. The two-year closed at 4.63, 56 basis points under its
own 2023 peak.
The two-year’s refusal needs a discount before it counts. In October 2023 the funds rate stood at
5.25–5.50 per cent; today it is 3.50–3.75, and a two-year note trades the funds rate. It could
hardly have made a new high. The ten-year has no such excuse, and the ten-year is the one that
matters: it is the benchmark that mortgages, corporate debt and equity valuations are priced from,
and in the week the thirty-year went through its 2007 peak, the ten-year stopped short.
More telling than the levels is the shape of the week. Friday to Friday, the two-year yield rose 26
basis points — its biggest week all summer — the ten-year 18, and the thirty-year 11. On 28 August
this desk described the wrong end of the curve: a summer
in which the damage scaled with duration and the two-year barely moved. This week ran the other way.
The front end did the selling, which is what a market does when it believes a central bank is about
to act, and the long end — where the fear of inflation is actually stored — rose at less than half
the pace. The gap between the two-year and the thirty-year has narrowed from 108 basis points on 14
August to 72, the narrowest since 22 June.
The hedgers were already there. In the commitments report dated Tuesday 8 September — before the
inflation data, before the ECB — the commercial book in the thirty-year added 25,604 contracts to
137,912 net long, the 96th percentile of three years and one of the three new highs
Friday’s Ledger flagged. It is the same book that flipped long in late
April and has stayed long since, bar one week at the end of June, through the whole of this summer’s
selloff.
The last grain to make a high
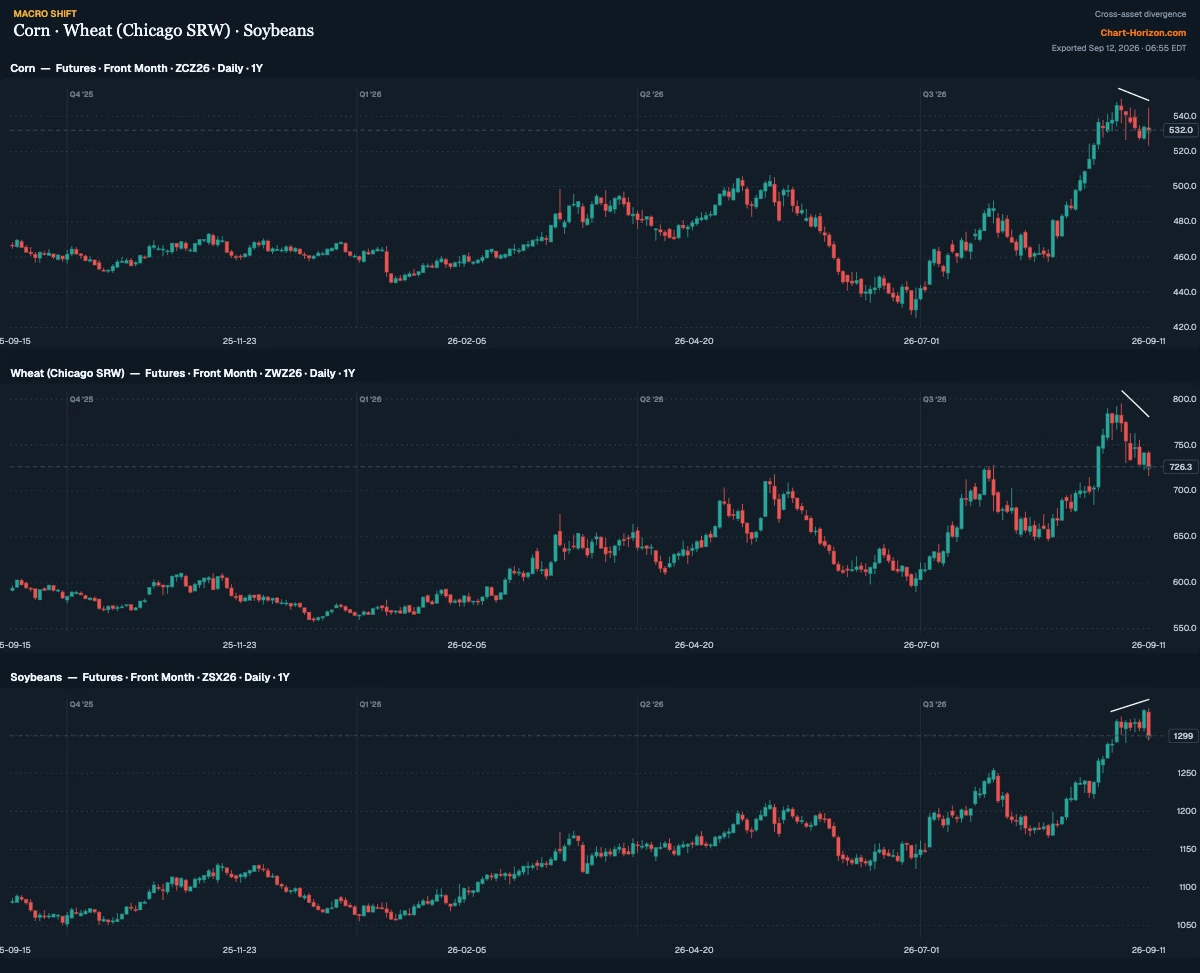
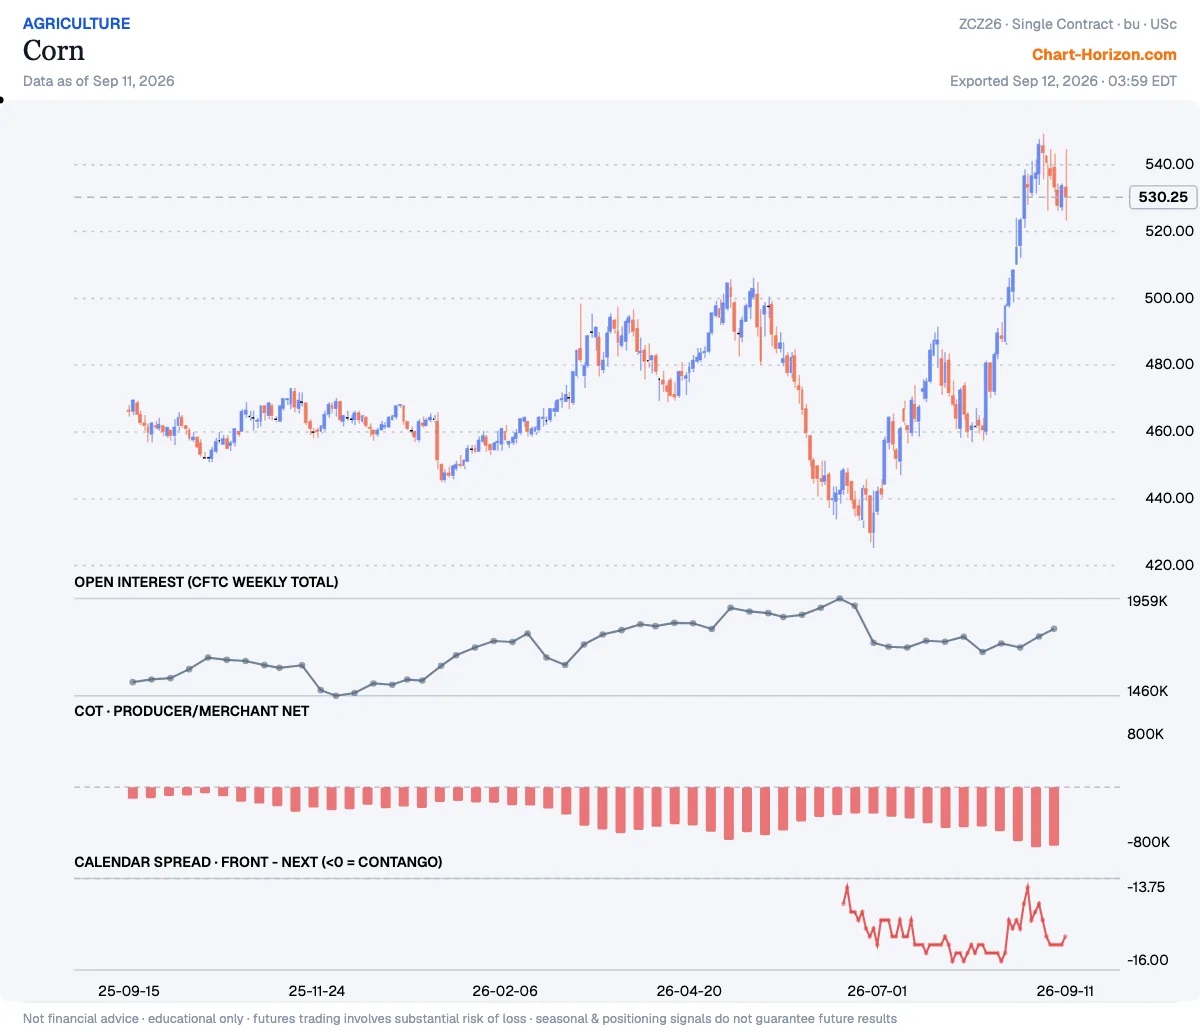
Corn (Dec) · Chicago wheat (Dec) · Soybeans (Nov) · futures, daily, one year · ChartHorizon
The grain rally was real, and it had reasons. A sudden escalation in attacks on Black Sea shipping
lanes and port infrastructure in mid-July constrained the world’s wheat supply, and the US corn crop
entered September with 56 per cent rated good to excellent, its weakest start to the month in three
years, DTN reported. On 28 August corn and wheat traded at their highest prices in more than three
years. December corn rallied almost ninety cents from the August crop report to its early-September
peak.
For two of the three, that peak came on 2 September. December wheat set 795 that day and has not
traded above 776 since; it settled Friday at 725¼, 8.8 per cent below the top. December corn set
549¾. On Friday it tried again, reached 544¾, and settled at 530¼.
Soybeans kept going. November beans made 1324 on 2 September, 1333½ on Thursday and 1335¼ on Friday
— the day the Department of Agriculture published its September estimates. All six headline numbers
for corn and soybeans, yield, production and ending stocks for each, came in above the trade’s
estimates. The soybean yield was put at 52.8 bushels an acre against 52.5 expected, raised from
August’s 52.7 when the trade had pencilled in a cut, and soybean ending stocks at 310 million bushels
against estimates of 290 to 298. November beans settled at 1296½, down 35¾ cents. The day’s high was
above Thursday’s high and its close was below Thursday’s low: an outside reversal, printed by the
last member of the family still making new highs, on the day the supply side stopped cooperating.
The commitments data needs reading with some care here. In the report dated 8 September the
producer/merchant book sits at the 1st percentile of three years in all three markets — hedgers
selling forward into the highest prices in years, which is their job. As the Ledger put it, a short
that deep describes the rally more than it predicts its end. What is worth noticing is the direction
of the latest week. In corn and wheat, the two that had already stopped making highs, the hedgers
bought back about 19,000 contracts each. In soybeans, still rising, they sold another 5,587.
Who refused on the dollar’s behalf
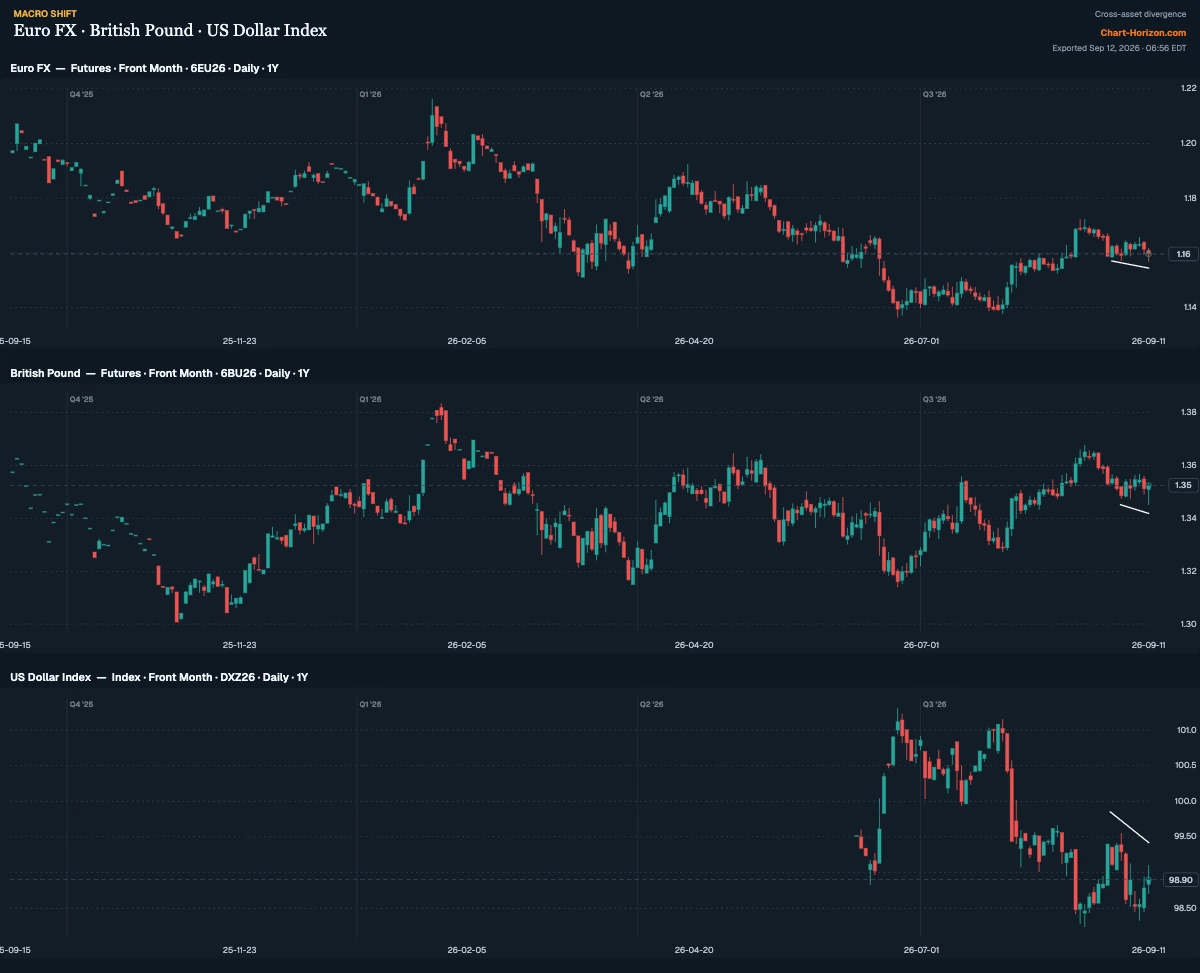
Euro FX (Sep) · British pound (Sep) · US Dollar Index (Dec) · futures, daily, one year · ChartHorizon
The euro’s September contract made 1.1572 on 2 September and 1.1567 on Friday. The pound made 1.3475
and then 1.3451. Two lower lows, in the euro and the pound, and so a dollar index that should have
made a higher high. It did not: the December contract topped at 99.555 on 2 September and could
reach only 99.10 on Friday.
This is the divergence that needs the most care, because the index has six members and the chart
shows two. Take the dollar index from its close on 2 September to Friday’s: down 0.44 per cent. The
euro, 57.6 per cent of the index, accounts for about 0.03 of that. The pound accounts for about
0.03. The franc and the Canadian dollar pushed the other way. The yen — 13.6 per cent of the index,
up 3.3 per cent against the dollar in six sessions, from 158.78 to 153.70 — accounts for about
0.45. Almost the entire refusal is the yen, and the yen is rising for one reason: a Bank of Japan
hike next Friday that the market has close to fully priced.
So the honest version of this chart is narrower than it looks. The currency whose central bank
raised rates on Thursday made a new low on Friday. The desk’s own strength board, dated 11
September, still has the dollar as the second-strongest of the eight majors at +2.3, and puts both
the euro (−0.9) and the pound (−1.6) below the line. And the yen’s own hedgers went the other way:
the report dated 8 September has their net position down 111,602 contracts to 14,041 net short, the
largest one-week move in the archive — the reversal the Ledger set against
the test this desk had called met the week before.
Where the positioning does lean with the chart is everywhere else. Commercials in the euro and the
pound sit in the top fifth of their three-year ranges, and in the dollar index in the bottom eighth.
The index that should have broken first
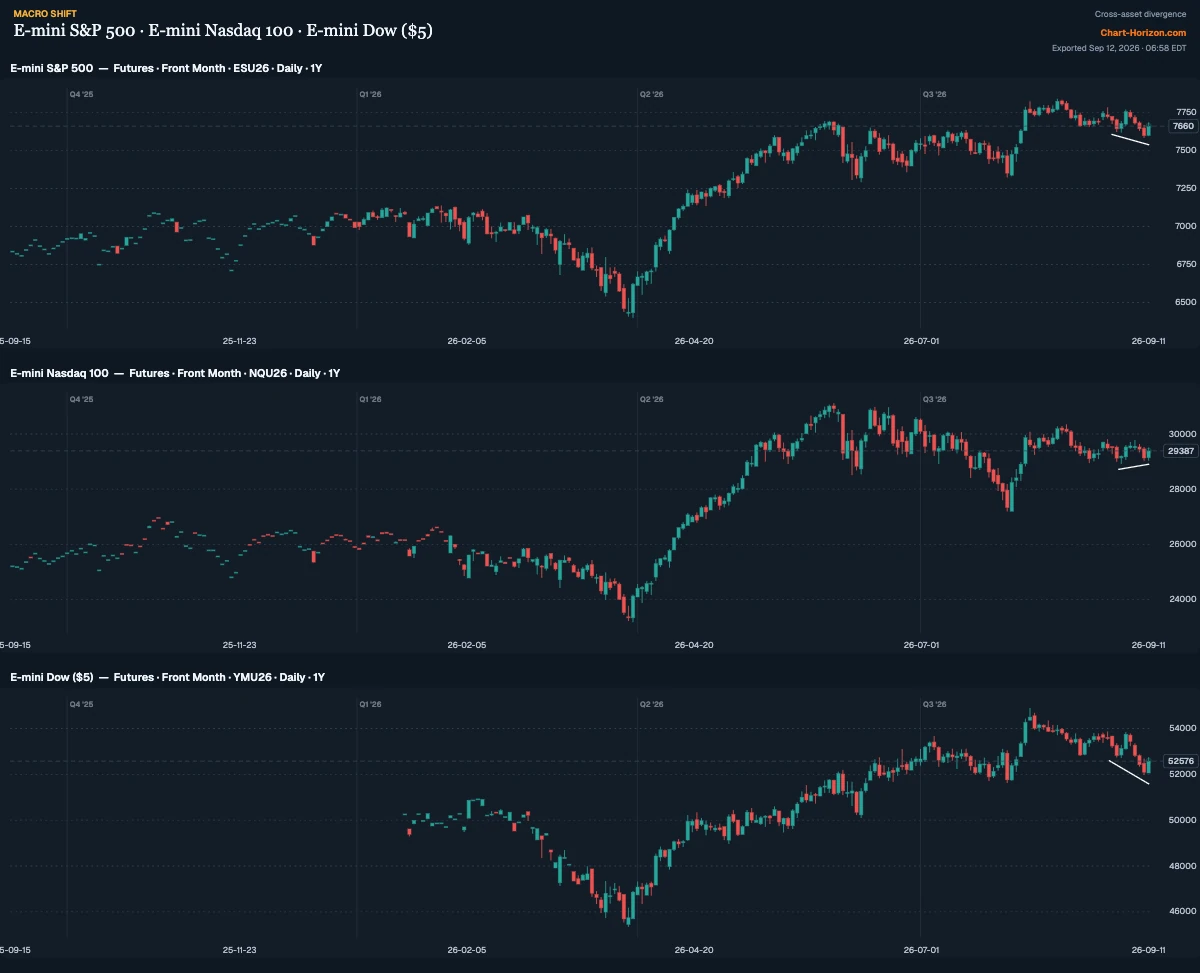
E-mini S&P 500 · E-mini Nasdaq 100 · E-mini Dow ($5) · September futures, daily, one year · ChartHorizon
The September S&P contract made 7,618½ on 2 September and 7,585½ on Thursday. The Dow went from
52,720 to 51,992. The Nasdaq 100, having made 28,927¼ on 2 September, held at 29,040½.
What makes that worth a paragraph is which index held. On the usual reading the Nasdaq 100 is the
most rate-sensitive of the three: its valuations rest furthest in the future, which makes it the
equity market’s version of a long bond. In the week the thirty-year yield went through its 2007
peak, the index that should have broken first is the one that did not break. On Friday stocks
snapped a four-day losing streak as oil eased and the inflation report landed close to expectations,
the S&P 500 closing up 0.9 per cent at 7,656.98. On the week it still lost 0.8 per cent, and the Dow
1.6.
Here the positioning is no help, and it should be said plainly. The commercial books in all three
index contracts sit in the lower third of their three-year ranges, the Dow’s in the bottom eighth.
If the stock half of this argument is right, it is right on price alone.
The one that has not signed
Put together, the four divergences describe one possibility: that the summer’s regime — commodities
up, long yields up, the dollar firm, equities under pressure — is beginning to turn into its
opposite. In the chain John Murphy laid out in Intermarket Analysis, which sits on this desk’s
reading-room shelf, falling commodity prices are good for bonds, and rising bonds are
good for stocks. This week the first link and the last refused the trend together, and the bond
market in between has begun, at the long end, to take the central banks at their word.
There is a hole in that reading, and it is the size of the energy complex. Grains are not what is
driving this inflation; energy is. Brent rose 8.7 per cent on the week and WTI 9.4, with Thursday’s
highs at about $108 and above $104. The hikes being priced this week — at the Fed on Wednesday, and
delivered by the ECB on Thursday — are oil’s hikes, and a commodity top that does not include oil is
a grain top, not an inflation top.
Oil did give ground on Friday. Brent settled 2.8 per cent lower at $104.61 and WTI 2.4 per cent lower
at $100.05, ending runs of five and eight straight gains, after Iranian state media said Tehran
would meet Gulf states in Oman to discuss the Strait of Hormuz. That is one headline and one session.
The four charts above are the market voting on a turn. Oil has not voted.
What would confirm it
In August this desk named two conditions for the yen in advance and came back to report on both. The
same standard applies here: five things, each checkable, each capable of failing.
The ten-year stays under 4.98 per cent. A close above its October 2023 peak confirms the
thirty-year’s break and ends the bond divergence outright. It is two basis points away, and the
Fed decides on Wednesday.
November soybeans stay under 1335¼. Friday’s outside reversal is only a top if its high holds.
The dollar index still cannot make a higher high once the Bank of Japan has delivered. If the
refusal is only the yen pricing a hike, it should fade after the hike on the 18th. A December
contract through 99.555 confirms the euro’s and the pound’s lows and ends this part of the
argument.
The Nasdaq 100 holds its 2 September low through Wednesday while the other two stay below
theirs. The September contracts expire on the 18th, so the test has to be passed before then.
Oil follows the grains. Brent back under $100 would be the first sign that the commodity
actually driving the inflation has joined the turn. Without it, the other four are a sector story
told in four markets.
The read
None of this says the turn has happened. Every piece of news this week argued the other way, and the
news may simply be right: a Fed that hikes on Wednesday into 3.4 per cent inflation and $100 oil has
more work ahead of it, and the ten-year may yet go through. What the charts show is narrower, and
more useful for being narrower. The members of the summer’s trade stopped agreeing with one another
in the very week its case was made most loudly.
Markets rarely turn when the news changes. They turn when the last piece of news the trend needed has
been delivered, and the thing this week’s headlines had in common is that they all delivered.
Wednesday’s hike is nine-tenths priced. The Bank of Japan’s is priced. The ECB’s is done.
The commitments report dated Tuesday 15 September — published on the 18th, the day the Bank of Japan
decides — will be the first to show positioning taken after the inflation report and the ECB’s hike.
By then the four families will either have settled their disagreement, or it will have turned out to
be the first sign that the trade everyone could see had run out of people left to join it.
]]>ChartHorizonNew Hedger Highs in Russell 2000, Bonds and Milk; New Low in Copper2026-09-11T00:00:00+02:002026-09-11T00:00:00+02:00https://chart-horizon.com/2026/09/11/hedgers-ledgerThe report dated 8 September puts nine markets at the edge of their three-year positioning range: six at lows, three at highs. The low side is last week’s farm cluster, intact — Corn, Wheat, Soybeans and Cotton at the 1st percentile, Sugar at a fresh three-year record — with Copper added to it; Corn, Wheat and Cotton came off the records they set a week ago, but none of last week’s five lows has left the board. All six trade in the upper third of their one-year price range, which is where producers sell forward, so a hedger short this deep describes the rally more than it predicts its end. The three highs are all new: the E-mini Russell 2000, the 30-Year T-Bond and Class III Milk. Lean Hogs, last week’s only high, dropped back out of the top five percent.
Market
Side
Percentile
New
Sugar #11
▼ LOW
1st
Corn
▼ LOW
1st
Wheat (Chicago SRW)
▼ LOW
1st
Soybeans
▼ LOW
1st
E-mini Russell 2000
▲ HIGH
99th
New
Cotton #2
▼ LOW
1st
Copper
▼ LOW
2nd
New
30-Year U.S. T-Bond
▲ HIGH
96th
New
Class III Milk
▲ HIGH
96th
New
Sugar #11 — commercials at a 3-year LOW (fresh record)
Producer/Merchant Net sits at the 1st percentile of its ~3-year range — the commercials (hedgers, the “smart-money” side) have been heavy net sellers. That is a fresh record for the window. Net: -312,352 contracts (as of 2026-09-08).
Corn — commercials at a 3-year LOW
Producer/Merchant Net sits at the 1st percentile of its ~3-year range — the commercials (hedgers, the “smart-money” side) have been heavy net sellers. Net: -780,916 contracts (as of 2026-09-08).
Wheat (Chicago SRW) — commercials at a 3-year LOW
Producer/Merchant Net sits at the 1st percentile of its ~3-year range — the commercials (hedgers, the “smart-money” side) have been heavy net sellers. Net: -83,793 contracts (as of 2026-09-08).
Soybeans — commercials at a 3-year LOW
Producer/Merchant Net sits at the 1st percentile of its ~3-year range — the commercials (hedgers, the “smart-money” side) have been heavy net sellers. Net: -342,895 contracts (as of 2026-09-08).
E-mini Russell 2000 — commercials at a 3-year HIGH
Commercial Net sits at the 99th percentile of its ~3-year range — the commercials (hedgers, the “smart-money” side) have been heavy net buyers. Net: +77,130 contracts (as of 2026-09-08). New this week.
Cotton #2 — commercials at a 3-year LOW
Producer/Merchant Net sits at the 1st percentile of its ~3-year range — the commercials (hedgers, the “smart-money” side) have been heavy net sellers. Net: -174,281 contracts (as of 2026-09-08).
Copper — commercials at a 3-year LOW
Producer/Merchant Net sits at the 2nd percentile of its ~3-year range — the commercials (hedgers, the “smart-money” side) have been heavy net sellers. Net: -111,865 contracts (as of 2026-09-08). New this week.
30-Year U.S. T-Bond — commercials at a 3-year HIGH
Commercial Net sits at the 96th percentile of its ~3-year range — the commercials (hedgers, the “smart-money” side) have been heavy net buyers. Net: +137,912 contracts (as of 2026-09-08). New this week.
Class III Milk — commercials at a 3-year HIGH
Producer/Merchant Net sits at the 96th percentile of its ~3-year range — the commercials (hedgers, the “smart-money” side) have been heavy net buyers. Net: +6,083 contracts (as of 2026-09-08). New this week.
The hedging program
Where each market’s tracked COT net sits inside its own trailing six-month range — above the midpoint of that range or below it. This is the same positioning read at close quarters, and it answers a different question from the extremes above: a book can sit at a three-year low and still have been working higher for six months. What follows is only what MOVED — the markets that crossed that midpoint with this week’s report.
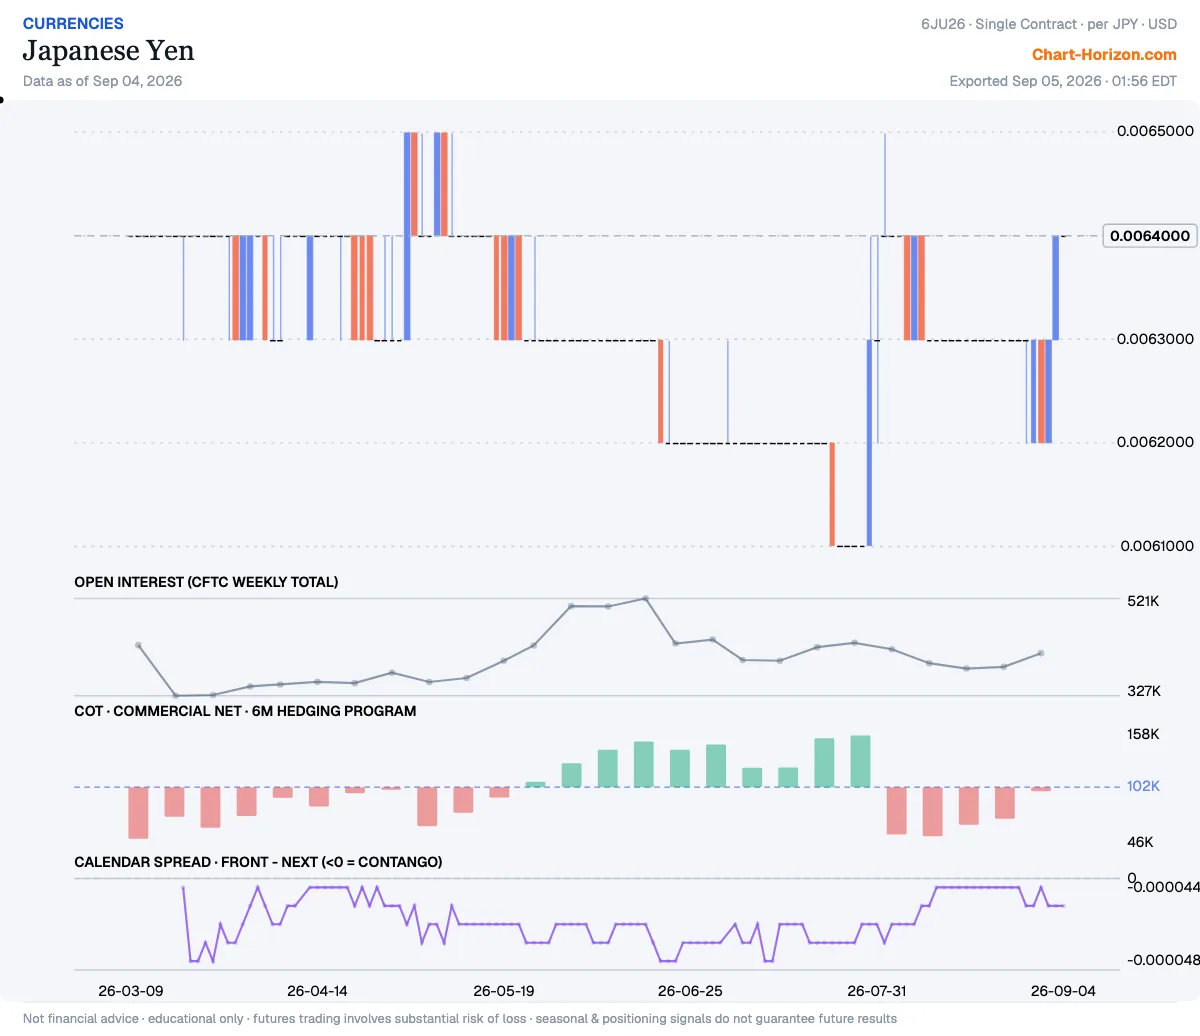
16 programs read above the midpoint of their own trailing six-month range this week, 23 below. Three crossed it with this report — Platinum from above to below, Soybean Oil from below to above and Japanese Yen from above to below. Two of the three undo turns made in last week’s issue: Soybean Oil had crossed downward then, and the yen upward.
Market
Turned
6-month program
Platinum
from above the midpoint
▼ below midpoint
Soybean Oil
from below the midpoint
▲ above midpoint
Japanese Yen
from above the midpoint
▼ below midpoint
Platinum — the program turns bearish
In the CFTC report of 2026-09-08, Producer/Merchant Net crossed the midpoint of its own trailing six-month range: it now sits below that midpoint, where the previous report still had it above. It cleared that midpoint by 1.4% of the window’s own range — a crossing on the definition, and a coin-flip in fact.
Soybean Oil — the program turns bullish
In the CFTC report of 2026-09-08, Producer/Merchant Net crossed the midpoint of its own trailing six-month range: it now sits above that midpoint, where the previous report still had it below. It cleared that midpoint by 4.7% of the window’s own range.
Japanese Yen — the program turns bearish
In the CFTC report of 2026-09-08, Commercial Net crossed the midpoint of its own trailing six-month range: it now sits below that midpoint, where the previous report still had it above. It cleared that midpoint by 50.0% of the window’s own range — which is all the distance there is: the net now sits at the bottom of its six-month window.
It got there in one report: Commercial Net fell from +97,561 contracts to −14,041, the largest one-week move for this market in an archive that starts in June 2021, while the yen futures price rose 4.2%. This is the book whose rebuild The Cheaper Instrument counted on 6 September as a test met, naming a long that keeps climbing through the Bank of Japan’s meeting on the 18th as the confirmation to watch; a week before that meeting, the book is net short. The report was taken in the week before the September contract expires, when a roll can swell open interest (up 87,753 here), but across the 20 earlier reports from that week the net never moved more than 30,963 contracts — and the report dated 15 September, the first without that contract, is published on the day of the meeting.
]]>ChartHorizonThe Cheaper Instrument2026-09-06T00:00:00+02:002026-09-06T00:00:00+02:00https://chart-horizon.com/2026/09/06/the-cheaper-instrumentThere are two ways for a government to buy its own currency. It can buy the currency, or it can
change the reason people sell it. The first is an operation, the second is a policy, and this
summer has now priced both of them within five weeks of each other.
The first cost ¥15.39 trillion — about $98bn — and it is the largest month of yen buying in the
history of the exchange. It bought a flat line.
The second cost a sentence, and it moved the market more in one session than the record month
managed in four weeks.
The receipt
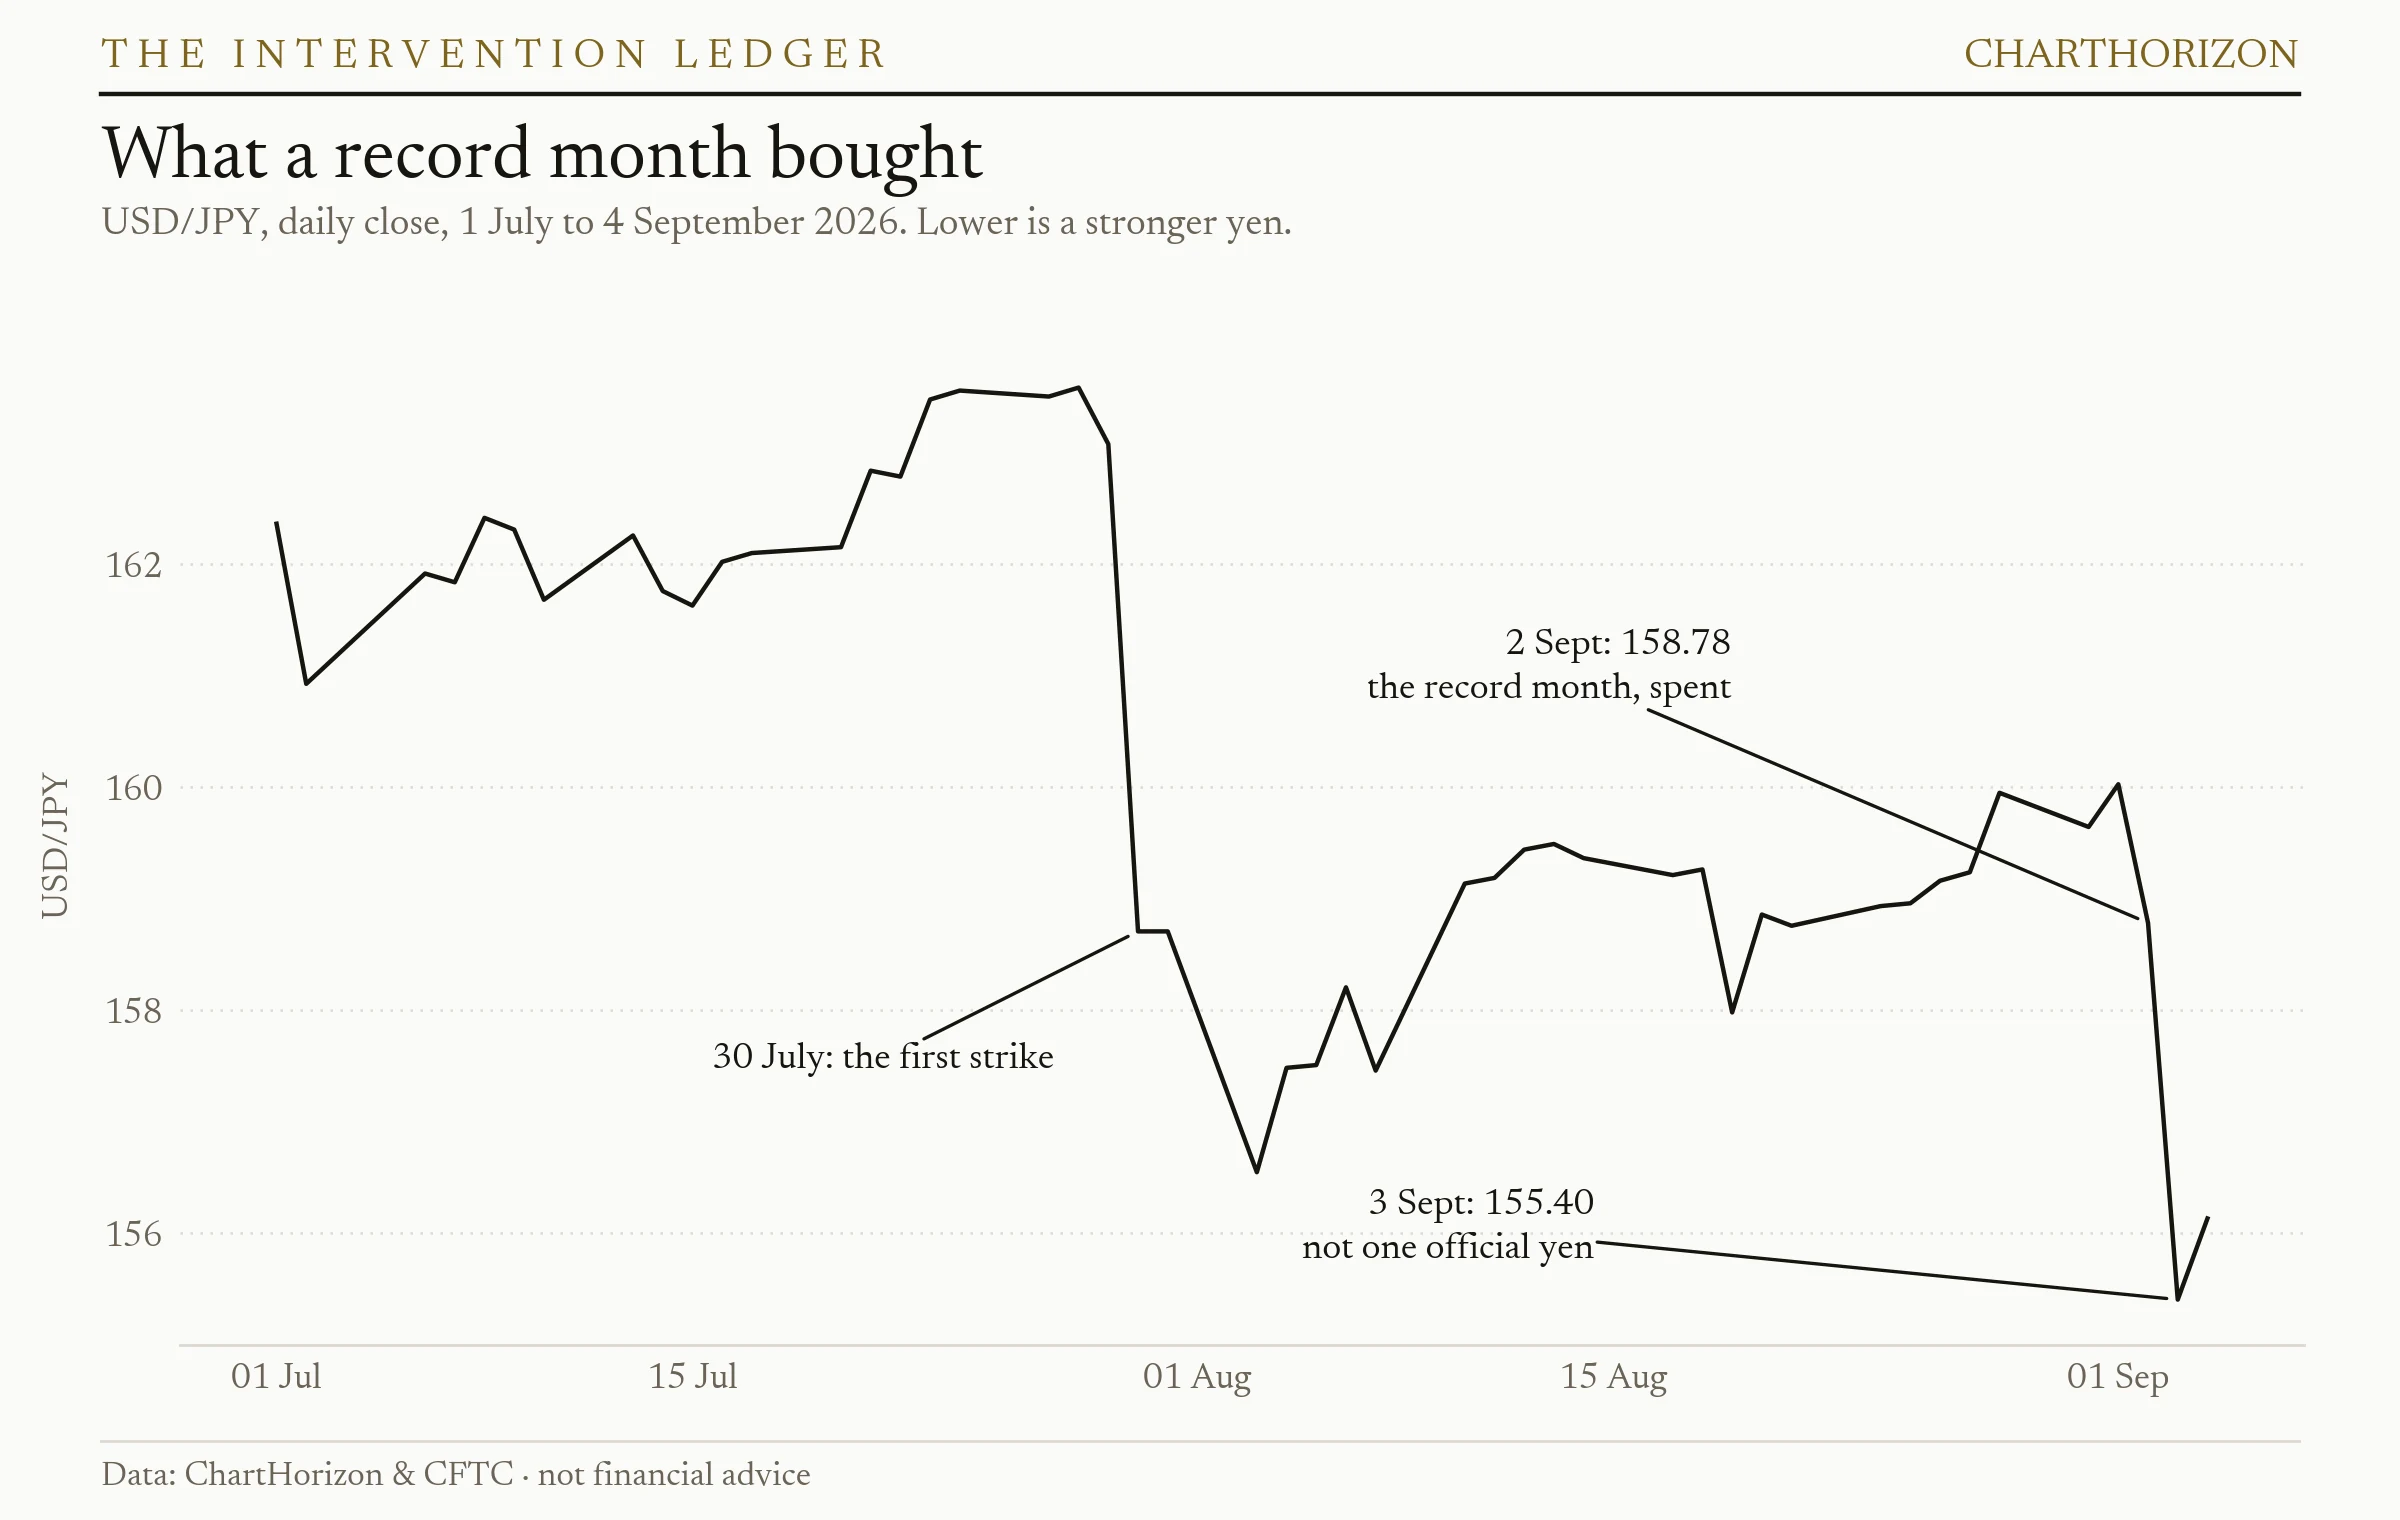
USD/JPY · daily close · 1 July – 4 September 2026 · ChartHorizon
The chronology is worth setting out cleanly, because the numbers in it are now official rather
than estimated.
On 23 July the dollar traded at 163.67, the weakest the yen had been since 1986. On the night
of 30 July the Ministry of Finance intervened and the dollar fell about five yen, closing at
158.70 — a 2.76 per cent day in the yen and still the largest of 2026. On the following night
Washington joined, an event Tokyo’s own press dated as the first coordinated operation in
twenty-eight years. (This desk wrote first since 2011 at the time. Both are defensible: 2011 is
the last multilateral G7 action, 1998 the last bilateral one. The Japanese count is the stricter
of the two and the better one to use.)
Then, on 28 August, the Ministry published the tally for the reporting window running 30 July to
26 August: ¥15.39 trillion,
against a previous monthly record of ¥11.73 trillion set in the April–May window of this same
year. Not a large month. The largest month there has ever been, by thirty-one per cent.
Here is what it bought. The dollar closed the night of the first strike at 158.70. On 2
September — the record spent, the window closed, the receipt filed — it closed at 158.78.
Eight sen the wrong way. Four weeks, ninety-eight billion dollars, and the market ended fractionally
further from where the Ministry wanted it than it had been before the money was spent.
The other instrument
On Thursday 3 September the yen rose 2.18 per cent, closing at 155.40 and touching 155.21
intraday — its best level since 3 August and the third-largest up-day of the year, behind only 30
July and 30 April. It traded 428,747 contracts, the heaviest session in the front contract since
it rolled on 17 August.
No money was spent. Analysts looking for the signature found none: there was no dislocation in
the electronic matching systems of the kind an operation leaves behind, and the move ran through
the session rather than arriving in one block after hours. What had happened instead was that on
2 September Governor Ueda signalled the chance of a hike
at the 18 September meeting, saying the Bank had come to believe it must pay greater attention
than before to upside risks as underlying inflation approaches two per cent. He was not alone.
At least three of the nine board members have now argued the Bank could raise faster than its
current pace of roughly two increases a year, and the American Treasury Secretary has spent the
summer publicly asking for the same thing. By Thursday the market had a September move close to
fully priced.
That is the whole of it. A committee changed the emphasis of a sentence, and the yen did in six
hours what ninety-eight billion dollars could not do in four weeks.
The reason is not mysterious, and it is the only piece of theory in this note. An intervention
buys the price. A rate expectation buys the reason for the price. Nobody is short the yen
because the yen is cheap; they are short it because it is cheap to borrow, and the cost of
carrying that short is paid every day out of the differential. The Ministry of Finance cannot
touch the differential. It can only make one evening’s borrowing painful and then stop, and a
market that has been leaned on for a year is very good at waiting out an evening. The Bank of
Japan sets the number the trade actually pays. Which is why the expensive instrument moves the
price and the cheap one moves the position.
It was not the dollar
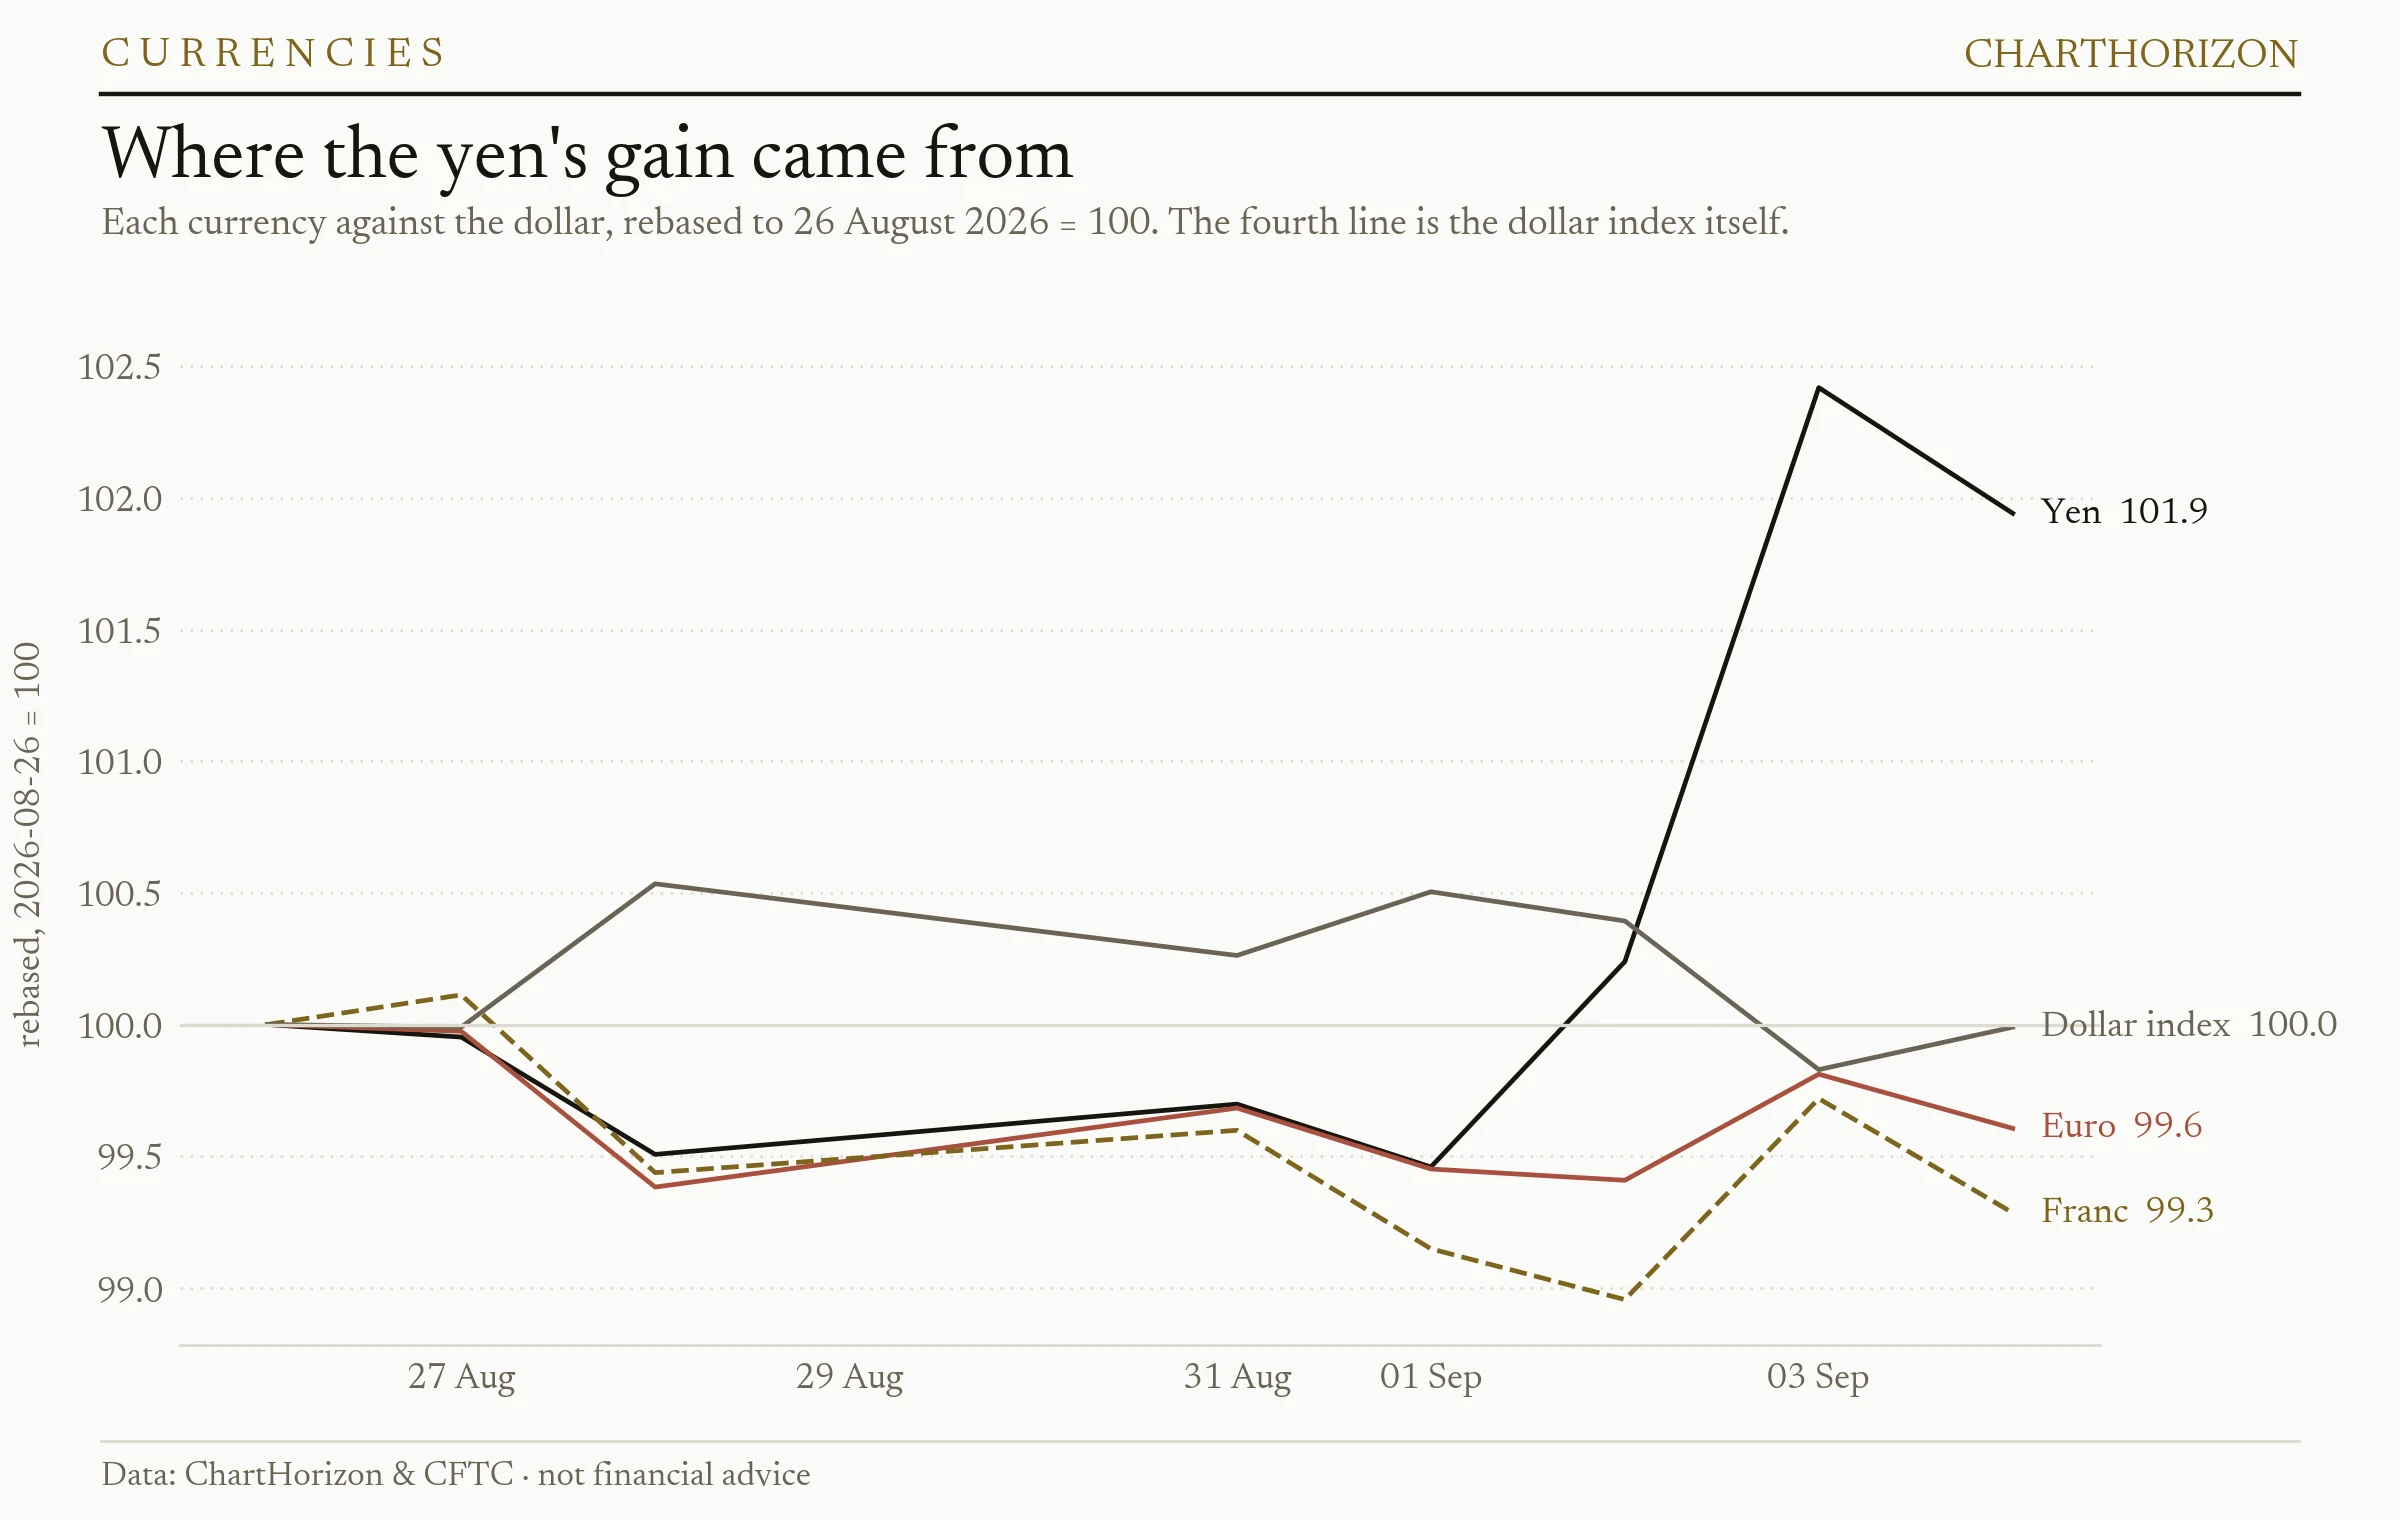
Yen, euro, franc against the dollar, and the dollar index · rebased 26 Aug 2026 = 100 · ChartHorizon
The obvious objection to all of the above is that the dollar simply had a bad week and the yen was
carried along with everything else. The tape says otherwise, and says it flatly.
Measured from 26 August, the day the Ministry’s reporting window closed, the yen is up 1.94 per
cent against the dollar. Over the identical span the dollar index is down 0.01 per cent —
unchanged to the second decimal. The euro is down 0.39 per cent and the Swiss franc down 0.72.
So this was not a dollar move. The dollar went nowhere; the yen went up and the other two funding
currencies went down. Money did not leave the carry trade. It moved one seat along the bench,
which is what it did in August when it refinanced out of the yen and into the euro,
and which it is now doing again, one currency further down the rate table. This desk’s own
strength board has the franc as the weakest of the eight majors at −4, and the arithmetic behind
that is not sentiment: the Swiss National Bank’s policy rate is 0.00 per cent against the Bank of
Japan’s 1.00, and a Japanese hike on the 18th widens that gap rather than closing it.
That matters for a reason beyond bookkeeping. On 18 August this note set out two things that would
tell us the yen trade had genuinely begun to end. The first was that the cheapest money in the
developed world should become unambiguously Swiss rather than Japanese. Three weeks later, on the
desk’s own board and in the published policy rates, it has.
The book was already there
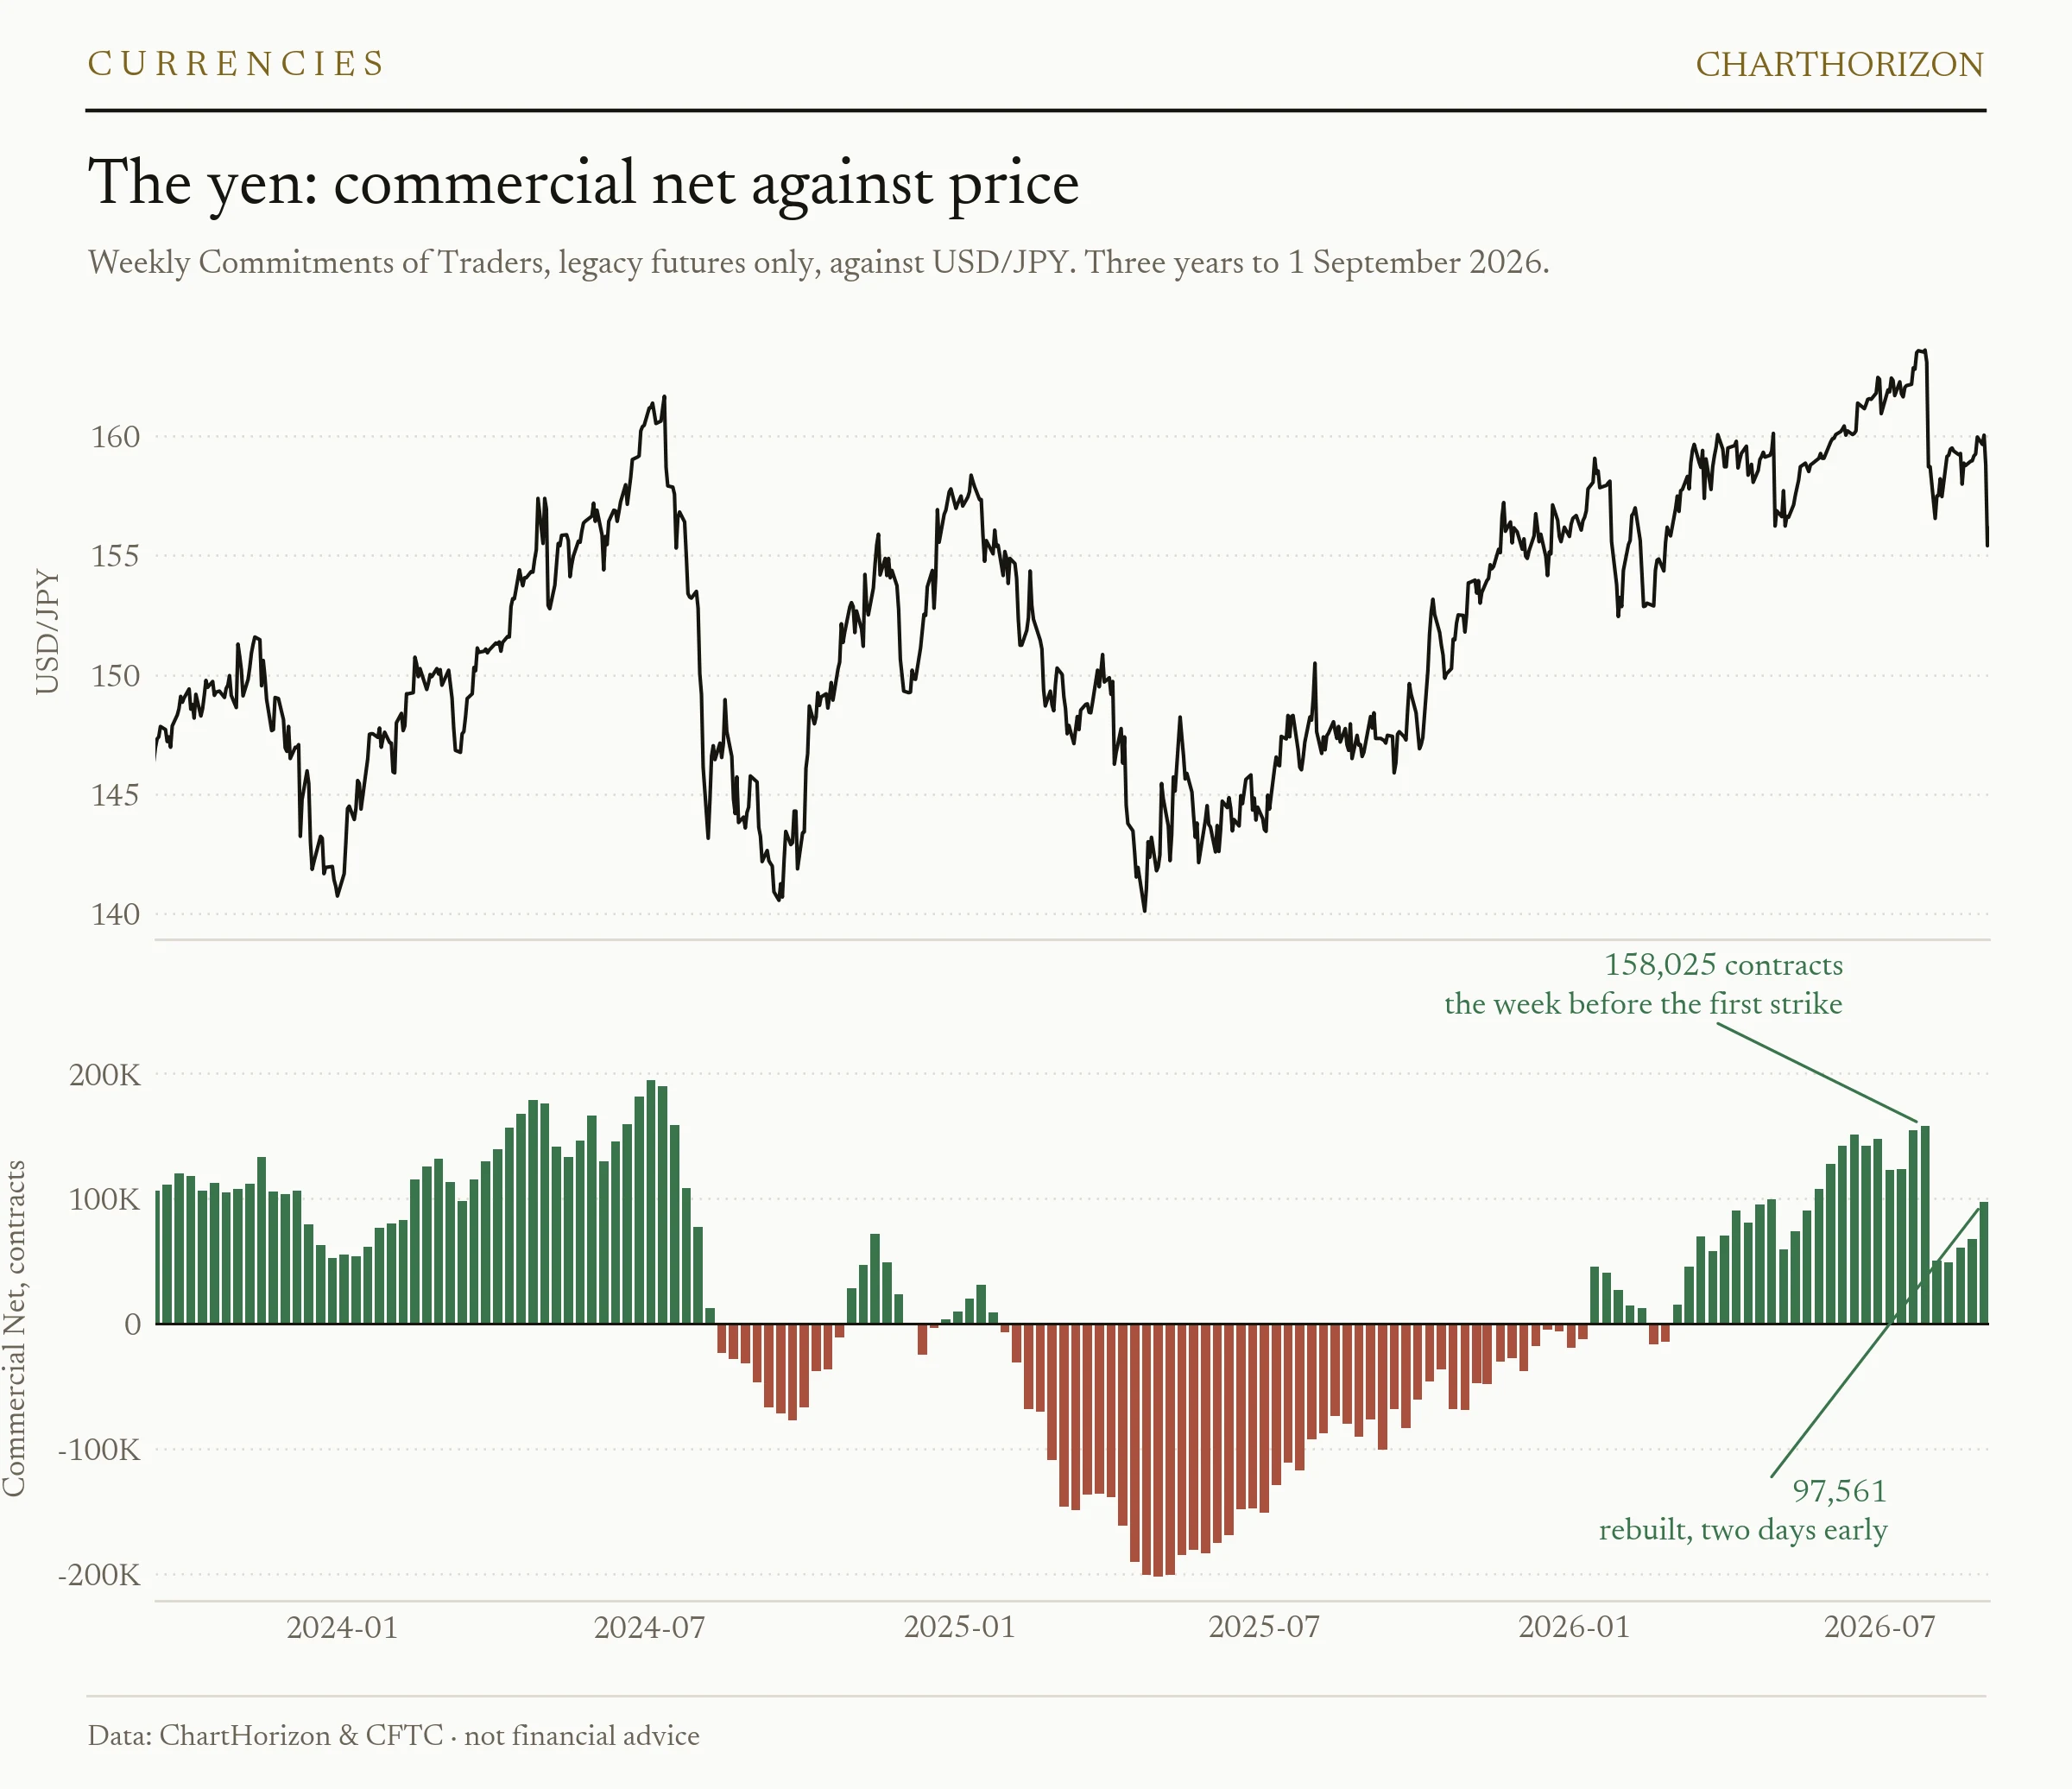
Japanese Yen · commercial net position vs. price · ChartHorizon & CFTC
The second test was more specific: a commercial book that starts climbing again from the 35th
percentile, while price is still weak, would say the same people who just sold are willing to pay
to be long again at a worse level.
CFTC report
Commercial net long
Open interest
28 Jul 2026
158,025
432,366
11 Aug 2026
48,769
391,874
18 Aug 2026
61,074
380,811
25 Aug 2026
67,837
384,216
1 Sep 2026
97,561
411,882
Three consecutive weeks of building. From 48,769 contracts to 97,561 — the book has been almost
exactly doubled, and it is back at the 70th percentile of every weekly report on the file. And
look at what the price did while they were doing it: the dollar closed the 11 August report at
159.19 and the 1 September report at 160.03. The yen did not firm during the rebuild. It got
weaker, and they bought it anyway, at a worse level than the one they had sold — which is the
precise condition the August note named.
The detail that matters most is in the right-hand column, and it is the mirror image of the one
that damned the August reports. When these hedgers dumped 109,000 contracts in the fortnight after
the intervention, open interest fell — the position was closed, not transferred, which is what
told us the squeeze had been spent rather than passed to someone else. Since the 18 August low,
open interest has risen by 31,071 contracts. New longs against new shorts. This is
accumulation, not somebody being bought out of a losing position.
And the date on that report is Tuesday 1 September. The move came on Thursday the 3rd. Two days.
I want to be careful about what that does and does not establish, because it is easy to make this
sound like foresight and it is not. The commercials are not forecasters; the same file has them
early by months and occasionally wrong outright, and this desk has said so in the middle of a
bullish reading before. What the sequence establishes is narrower and more useful: the people
whose business is the physical currency spent three quiet weeks positioning for the rate story
while the rest of the market was still watching the Ministry of Finance’s cheque book. They were
reading the cheaper instrument.
What this does not mean
It does not mean the yen has turned. On the strength board dated 5 September the yen still scores
−1.1 — third weakest of the eight majors, ahead of only the franc and the New Zealand dollar.
A currency does not become strong by having one very good Thursday.
Nor is a September hike the end of anything. The Bank of Japan is at 1.00 per cent. The Federal
Reserve is at 3.50–3.75. Twenty-five basis points takes a gap of 2.63 percentage points to 2.38,
and a trade that has been paid two and a half points a year to stay short does not close because
that becomes two and a quarter. The differential is the mechanism, and the mechanism is still
overwhelmingly intact. What has changed is its direction, which is the part markets price long
before the arithmetic gets there.
There is also a fair defence of the Ministry to be made, and it should be made. The record month
did not buy a level, but it plausibly bought the time in which the rate expectation could form —
it kept the dollar from running through 165 while the board’s opinion turned, and a currency in
disorderly retreat is a much harder thing for a central bank to act into calmly. Judged as a
holding action rather than a reversal, ¥15.39 trillion looks less like failure and more like
expensive patience. It is worth noting that Tokyo has quietly arranged for the next round to be
funded through the Federal Reserve’s FIMA repo facility rather than by selling Treasuries, which
is a considerate thing to do to a
long end that spent the summer coming apart — and an
admission that they expect there to be a next round.
The read
Both of the tests this desk set out three weeks ago have now been met, and they were met in the
order the theory predicted: the funding advantage moved to Switzerland, and the hedgers began
paying up to be long the yen at a level no better than the one they sold. Neither of those things
required an intervention, and neither of them was caused by one.
So the position to hold is this. The trend is not yet broken — 163.67 stands, the yen is still in
the bottom half of the board, and one session does not undo a year. But the market has now
demonstrated, in public and within a week, what the two available instruments actually cost. One
of them is ¥15.39 trillion for eight sen in the wrong direction. The other is a change of emphasis
from a governor, and it is worth two per cent.
The 18th of September is the next reading, and the interesting question is no longer whether the
Bank moves. It is whether the yen holds its ground in the sessions after it does, with no
official bid underneath and the whole of the move already priced. That is the test a trend change
has to pass, and it is the only one left that has not been taken.
Watch the book while you wait. A commercial long that keeps climbing through the meeting is the
same signal, given a second time, by people who have already been right once this month.
]]>ChartHorizonNew Hedger Low in Soybeans; Record Lows in Corn, Wheat, Sugar and Cotton2026-09-05T00:00:00+02:002026-09-05T00:00:00+02:00https://chart-horizon.com/2026/09/05/hedgers-ledgerThe commercial book dated 1 September 2026 leans heavily to one side: five markets sit at positioning lows against the three-year range, one sits at a high, and four of those five lows are fresh window records. Soybeans join the low side this week for the first time. A board this lopsided — four simultaneous record extremes clustered on the same flank, with the lone outlier confined to Lean Hogs — is not something one sees in an ordinary week, and the tape has a way of resolving crowded rooms in the direction that causes the most pain to the most people.
Market
Side
Percentile
New
Corn
▼ LOW
1st
Wheat (Chicago SRW)
▼ LOW
1st
Sugar #11
▼ LOW
1st
Cotton #2
▼ LOW
1st
Lean Hogs
▲ HIGH
99th
Soybeans
▼ LOW
2nd
New
Corn — commercials at a 3-year LOW (fresh record)
Producer/Merchant Net sits at the 1st percentile of its ~3-year range — the commercials (hedgers, the “smart-money” side) have been heavy net sellers. That is a fresh record for the window. Net: -800,143 contracts (as of 2026-09-01).
Wheat (Chicago SRW) — commercials at a 3-year LOW (fresh record)
Producer/Merchant Net sits at the 1st percentile of its ~3-year range — the commercials (hedgers, the “smart-money” side) have been heavy net sellers. That is a fresh record for the window. Net: -102,406 contracts (as of 2026-09-01).
Sugar #11 — commercials at a 3-year LOW (fresh record)
Producer/Merchant Net sits at the 1st percentile of its ~3-year range — the commercials (hedgers, the “smart-money” side) have been heavy net sellers. That is a fresh record for the window. Net: -302,362 contracts (as of 2026-09-01).
Cotton #2 — commercials at a 3-year LOW (fresh record)
Producer/Merchant Net sits at the 1st percentile of its ~3-year range — the commercials (hedgers, the “smart-money” side) have been heavy net sellers. That is a fresh record for the window. Net: -178,611 contracts (as of 2026-09-01).
Lean Hogs — commercials at a 3-year HIGH
Producer/Merchant Net sits at the 99th percentile of its ~3-year range — the commercials (hedgers, the “smart-money” side) have covered shorts toward the least-short end of the window; the book is still net short. Net: -9,595 contracts (as of 2026-09-01).
Soybeans — commercials at a 3-year LOW
Producer/Merchant Net sits at the 2nd percentile of its ~3-year range — the commercials (hedgers, the “smart-money” side) have been heavy net sellers. Net: -337,308 contracts (as of 2026-09-01). New this week.
The hedging program
Where each market’s tracked COT net sits inside its own trailing six-month range — above the midpoint of that range or below it. This is the same positioning read at close quarters, and it answers a different question from the extremes above: a book can sit at a three-year low and still have been working higher for six months. What follows is only what MOVED — the markets that crossed that midpoint with this week’s report.
17 programs read above the midpoint of their own trailing six-month range this week, 22 below. Four crossed it with this report — Brent Crude Oil from below to above, Soybean Oil from above to below, Japanese Yen from below to above and Ethereum from below to above.
Market
Turned
6-month program
Brent Crude Oil
from below the midpoint
▲ above midpoint
Soybean Oil
from above the midpoint
▼ below midpoint
Japanese Yen
from below the midpoint
▲ above midpoint
Ethereum
from below the midpoint
▲ above midpoint
Brent Crude Oil — the program turns bullish
In the CFTC report of 2026-09-01, Producer/Merchant Net crossed the midpoint of its own trailing six-month range: it now sits above that midpoint, where the previous report still had it below. It cleared that midpoint by 4.3% of the window’s own range.
Soybean Oil — the program turns bearish
In the CFTC report of 2026-09-01, Producer/Merchant Net crossed the midpoint of its own trailing six-month range: it now sits below that midpoint, where the previous report still had it above. It cleared that midpoint by 12.4% of the window’s own range.
Japanese Yen — the program turns bullish
In the CFTC report of 2026-09-01, Commercial Net crossed the midpoint of its own trailing six-month range: it now sits above that midpoint, where the previous report still had it below. It cleared that midpoint by 7.7% of the window’s own range.
Ethereum — the program turns bullish
In the CFTC report of 2026-09-01, Leveraged Funds Net crossed the midpoint of its own trailing six-month range: it now sits above that midpoint, where the previous report still had it below. It cleared that midpoint by 30.3% of the window’s own range. The book tracked here is leveraged funds — a speculative cohort, not the hedger side.